Back to Event Manager Main Menu
Using the Event Dashboard
The event dashboard allows you to view and report on details about individual events, such as items sold, total revenue, total registrants, and spaces available. You also have the ability to search for, view, download, modify, and email registrants. You will first need to access the events list and select an event to view the reports.
- Click Events from the navigation menu and select Events List.
- Search or Filter the event list to locate the event you would like to manage.
- Click the Actions drop-down menu on the event you would like to manage.
- Click View Dashboard.

Event Dashboard
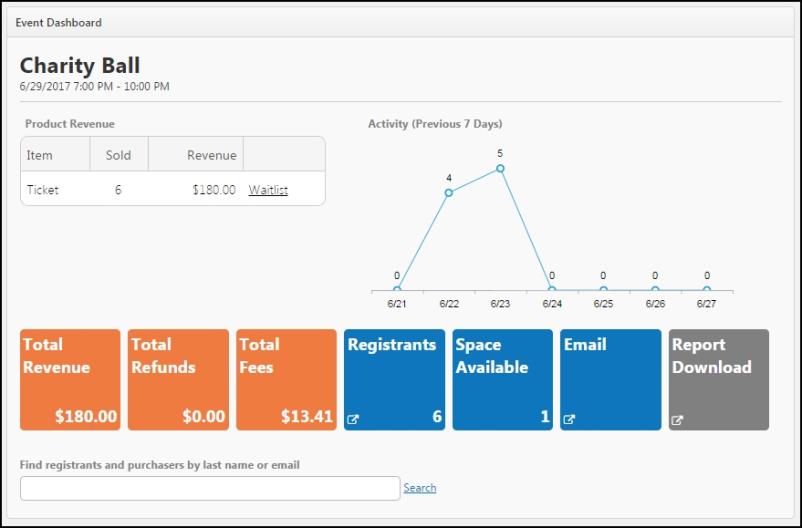
On the Event Dashboard, you will see:
- Event Date and Time
- Product Revenue - Displays a list of all registration and sale items purchased for the event. The items shown on the report include item name, quantity sold, and total revenue for each item. Free items are also shown in the report. If the Waitlist feature has been enabled for this event, a link to the Waitlist will also show in this table. *Note: Items that have been added to events, but do not have any registrations or purchases are not listed in the table.
- Activity (Previous 7 Days) - Displays a graph of the number of items purchased over the last 7 days, including the current day. The numbers shown in the graph include the total number of items sold across all items added to the event. *Note: The count per day includes the total number of registrants for that day. If one of those registrants cancels, their registration will still be counted here.
- Report Tiles - The colored tiles allow you to quickly view a summary of event activity:
- Orange tiles - Revenue
- Blue tiles - Registration information and email actions
- Gray tile - Reporting
- Registrant and Purchaser Search - Enter the last name or email address of a registrant or purchaser to be able to view or edit their information.
The orange revenue tiles display the total amounts of revenue, refunds, and fees for this particular event.
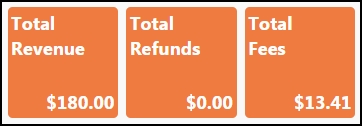
Total Revenue
Displays the total amount of funds collected for an event. The Total Revenue number will be the same as the total sum of the revenue column of the Product Revenue table. *Note: Total Revenue does not include PayPal fees or refunds however, it will include fees paid to Dude Solutions.
Total Refunds
Displays the total amount of money that was refunded to purchasers.
Total Fees
Displays the total amount of funds charged by and paid to Dude Solutions. These funds are automatically transferred to Dude Solutions and do not require any action by the calendar administrator to release payments.
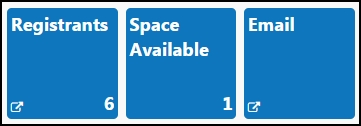
The blue registration tiles display registration information for a particular event and give you access to email attendees.
Registrants
Displays the total number of registration items purchased for an event. *Note: In order for an item to be included in this count, it must be added to an event with an item type of "Registrant". If an event has two registration items, adult and child registration, the sum of adult and child registrations will be shown. This number does not include the number of saleable items sold, such as t-shirts or hats.
- Click on the Registrants tile to view a list of people registered for the event. *Note: This page will only include information for items added to events as "Registration" items. Items added to events as "Sale Items" will not be included in the report.
- If the event has more than 15 registrations, multiple pages will be displayed on the table. You can change the page size to include more registrants by clicking the drop down next to Page Size.
- To change the attended status for a person, check the box under the Attended column.
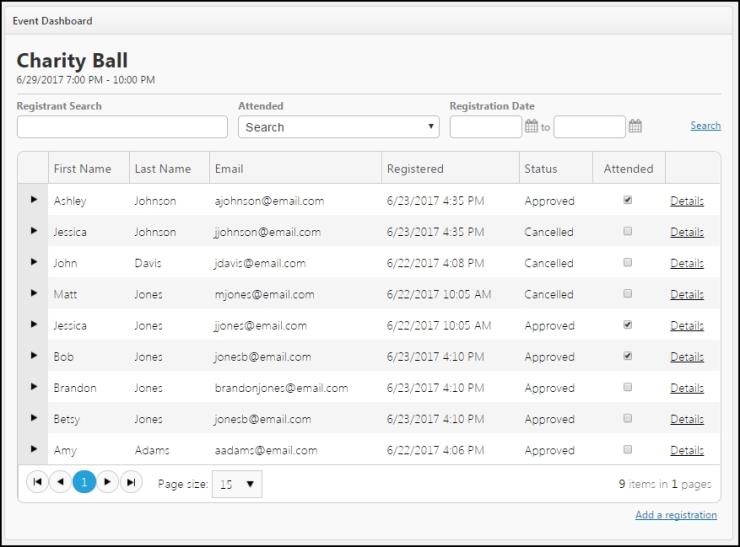
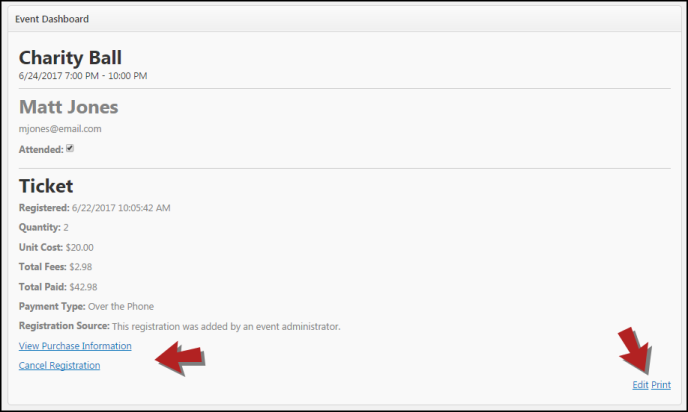
- To view additional information on a person who has registered for the event, click the Details link. Any information that was provided by the registrant will be listed on this screen.
- From this screen, you will have the ability to do the following:
- View Purchase Information - Allows you to view the details for the entire order, as well as process a refund if applicable and supported by your payment gateway.
- Cancel Registration - Allows you to cancel the registration, and release the space available for another person to register.
- Edit - Allows you to modify the information provided by the registrant.
- Print - Allows you to print the details of the registration that is currently displayed.
Space Available
Displays the remaining number of registration items available for an event. (Space Available = Total Available Registration Quantity - Sold Registration Quantity). *Note: This number will not include the remaining number of saleable items, such as t-shirts or hats.
Allows you to send emails to registrants, purchasers, and/or a custom list of email addresses.
- Click the Email tile to send an email.
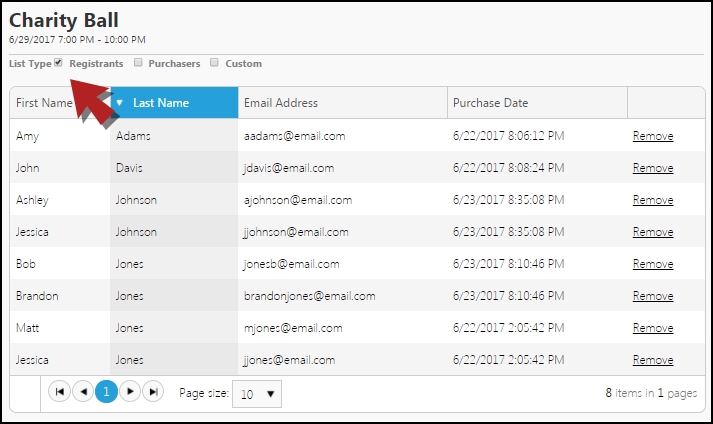
- Select the List Type by checking the appropriate box:
- Registrants - Anyone who has registered for an event.
- Purchasers - Anyone who has purchased an item, or provided their information on the confirmation page during checkout.
- Custom Email List - A list of email addresses that will receive the email.
- If you need to remove a person from the email list, click the Remove link for their name.
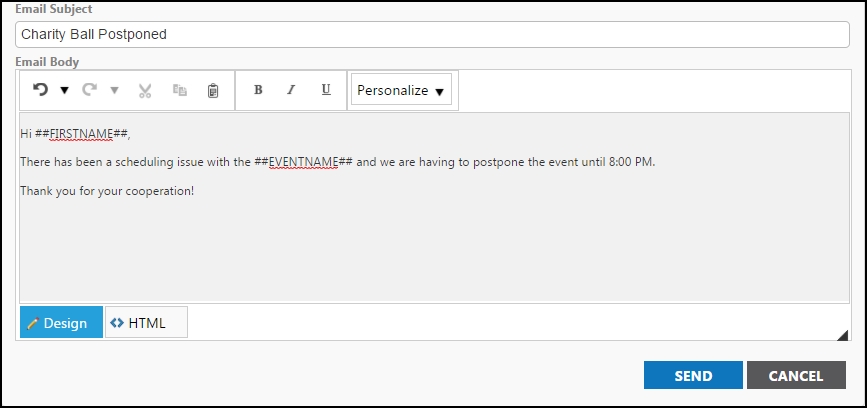
- When creating an email, you can specify an Email Subject and an Email Body:
- Email Subject - enter the text that will appear in the subject line of the email being sent.
- Email Body - enter the text that will appear in the body of the email. The message can be plain text or html and you can also use Tokens to automatically populate content into the email message.
- The following Tokens are available for use from the Personalize drop down menu:
Event Name: Displayed as ##EVENTNAME##. This token will automatically add the name of the event to the email when viewed by the recipient.
Start Date & Time: Displayed as ##STARTDATETIME##. This token will automatically add the Start Date and Time of the event in the following format: MM/DD/YYYY HH:MM AM/PM.
First Name: Displayed as ##FIRSTNAME##. This token will automatically add the first name of the purchaser or registrant to the email when viewed by the recipient. *Note: This token will not populate for email addresses added using the "Custom List" option. If this token is present and the recipient was added to the email using the "Custom List" option, a blank space will be added in the place of the token when viewed by the recipient.
Last Name: Displayed as ##LASTNAME##. This token will automatically add the last name of the purchaser or registrant to the email when viewed by the recipient. *Note: This token will not populate for email addresses added using the "Custom List" option. If this token is present and the recipient was added to the email using the "Custom List" option, a blank space will be added in the place of the token when viewed by the recipient.
Email Address: Displayed as ##EMAILADDRESS##. This token will add the email address used by the registrant or purchaser at time of registration. *Note: This token will not populate for email addresses added using the "Custom List" option. If this token is present and the recipient was added to the email using the "Custom List" option, a blank space will be added in the place of the token when viewed by the recipient.
- Click Send to send the emails.
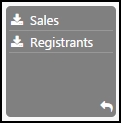
The gray Report Download tile gives you access to download either a Sales report or a Registrant report.
Sales Report Download
- Click the Report Download tile.
- Click Sales.
- Your report will download as a CSV file where you will be able to view event details such as Event Name, Event Start and End Dates/Times, and Revenue.
Registrants Report Download
- Click the Report Download tile.
- Click Registrants.
- Your report will download as a CSV file where you will be able to view registrant details such as First Name and Last Name, Email Address, and Phone Number.
