Setting up your dashboard
The Dashboard acts as your home page within SmartGov. This page gives you quick access to data you work with on a day to day basis. Each user can customize what information is displayed as well as the order and the format. Each list displayed on your dashboard can be searched and filtered using the standard search options. *Note: We recommend ordering your homepage to display graphs before lists.
Customizing the dashboard
- Click the Preferences link in the top right corner of the SmartGov homepage.
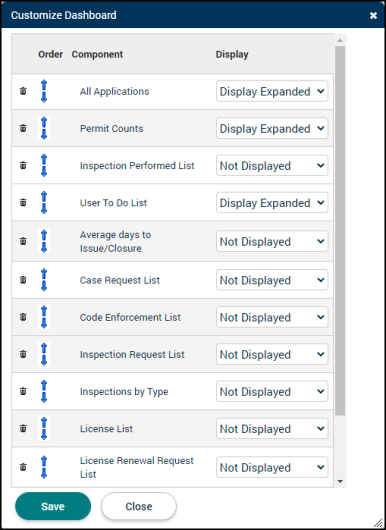
- Click Customize Dashboard. This will open the list of available dashboard components.
- Select either Display Expanded, Display Minimized, or Not Displayed for each component in the list.
- Display Expanded: This option will display the component on the dashboard.
- Display Minimized: This option will display a collapsed window of the component on the dashboard, which can be expanded to view its contents.
- Not Displayed: This option will remove the component from the dashboard.
- You can change the order in which the components will display by clicking either the up or down arrow icons next to each component.
- Click Save.
Managing the dashboard
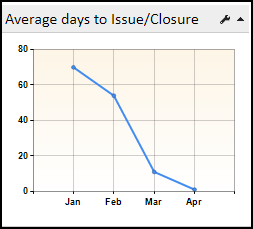
Average Days to Issue/Closure
This widget displays a graph of the average number of days for a permit to be issued or a code enforcement case to be closed within a certain time range.
To edit the contents of the graph:
- Click the wrench icon (
 ) in the top right corner of the widget.
 - Under Parameters, select the Date range that the graph should display from the drop-down menu.
- Select whether the graph data is pulled from the Permit Module or Code Enforcement Module.
- Select which Department the graph data is pulled from.
- Under Display Options, check the box to display the graph in 3D.
- Check the Show Values box to label each point on the graph with values.
- Check the Show Title box to display the title above the graph.
- Check the Medium Chart box to display a larger version of the graph on the dashboard.
- Click Save.
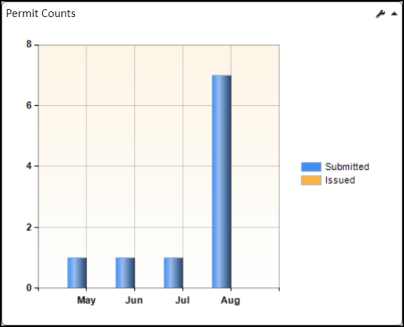
Permit counts
This widget displays a graph of the number of permits that have been submitted and issued within a certain time range.
To edit the contents of the graph:
- Click the wrench icon () in the top right corner of the widget.
- Select whether the graph data is pulled from the Permit Module or Code Enforcement Module.
- Select which Department the graph data is pulled from.
- Under Parameters, select the Date range that the graph should display from the drop-down menu.
- Under Display Options, check the box to display the graph in 3D.
- Check the Show Values box to label each point on the graph with values.
- Check the Show Title box to display the title above the graph.
- Check the Medium Chart box to display a larger version of the graph on the dashboard.
- Click Save.
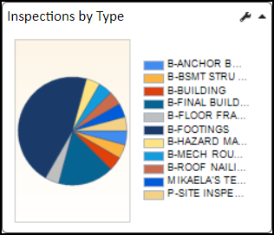
Inspections by type
This widget displays a graph of the number of Inspections in SmartGov broken down by type within a certain time range.
To edit the contents of the graph:
- Click the Wrench icon () in the top right corner of the widget.
- Under Parameters, enter text to filter the included inspections by Name.
- Select the Date range that the graph should display from the drop-down menu.
- Select whether the graph data is pulled from the Permit Module or Code Enforcement Module.
- Select which Department the graph data is pulled from.
- Under Display Options, check the box to display the graph in 3D.
- Check the Show Values box to label each point on the graph with values.
- Check the Show Title box to display the title above the graph.
- Check the Medium Chart box to display a larger version of the graph on the dashboard.
- Click Save.
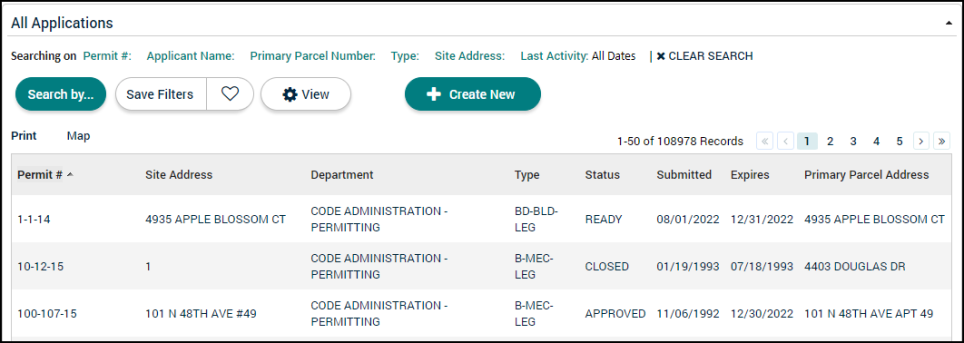
All applications
This widget displays a list of all permit applications within SmartGov. *Note: Any Default Filters defined here will also display when you open the Search Permits page and vice versa.
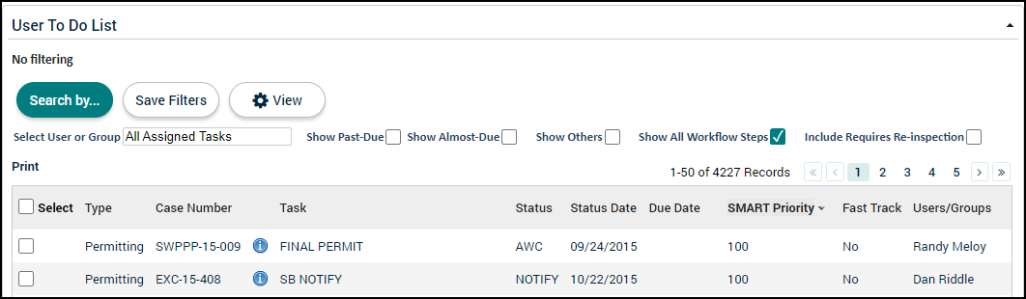
User to do list
The User To Do List displays all records that are assigned to a particular user or group, as well as pertinent details about the status of those records. This widget defaults to show the To Do list for your account. You can change which user or group's To Do list you are viewing and Reassign Selected Records from this list.
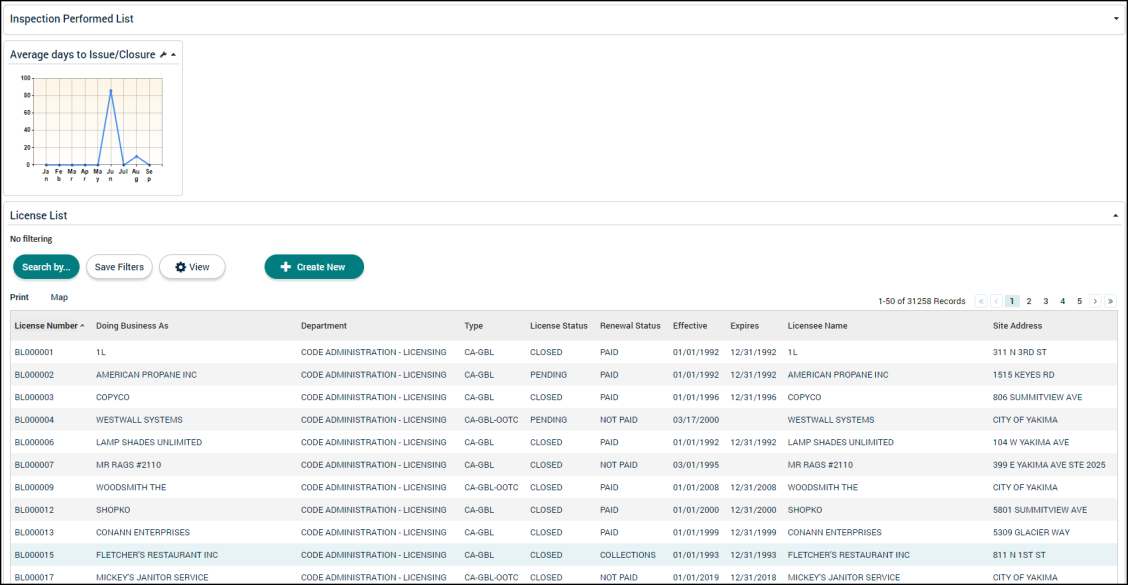
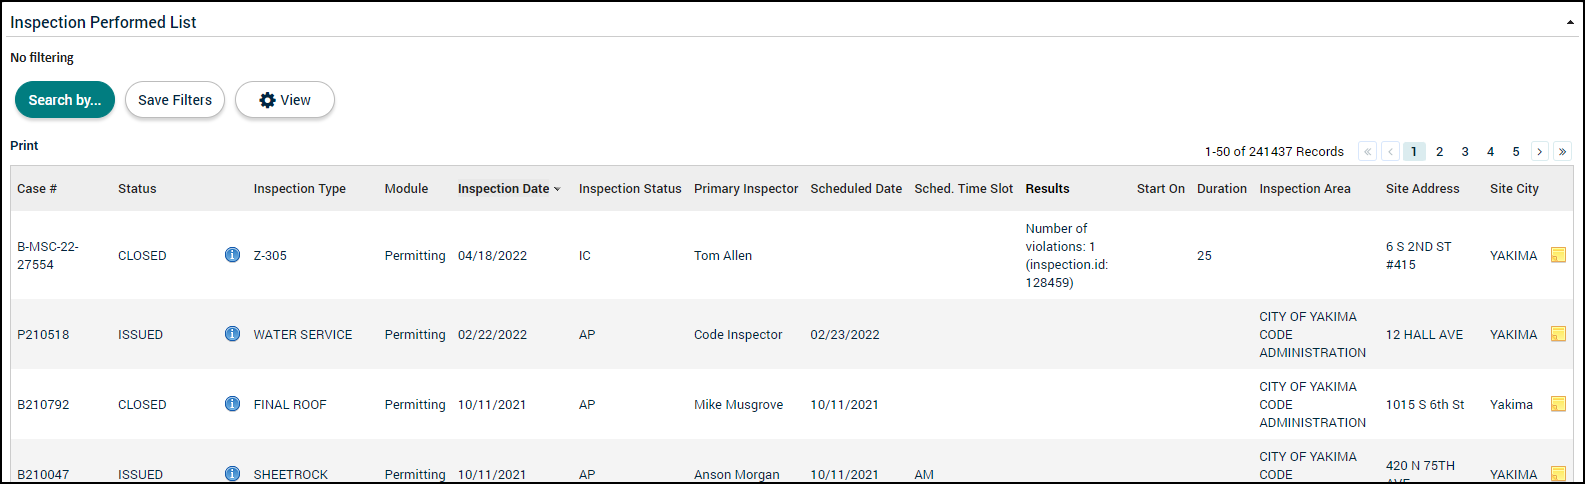
Inspection performed list
This widget displays a list of all completed inspections within SmartGov.
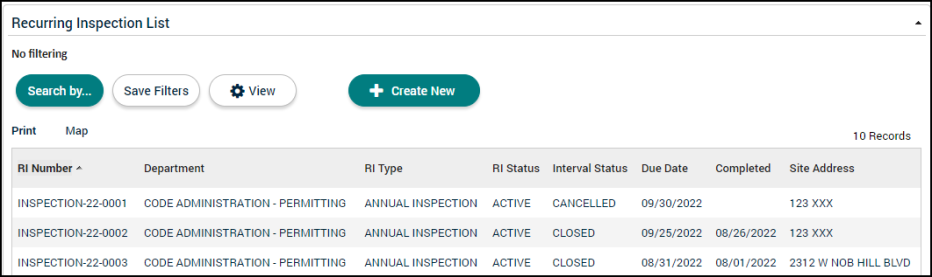
Recurring inspection list
This widget displays a list of all Recurring Inspection Accounts within SmartGov.
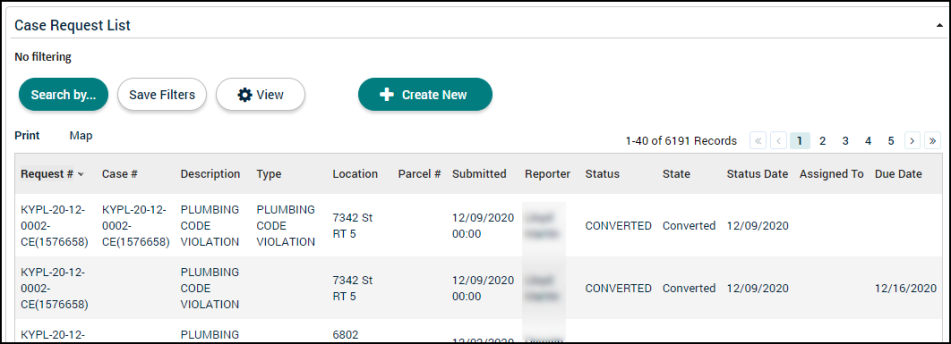
Case request list
This widget displays a list of all Case Requests within SmartGov.
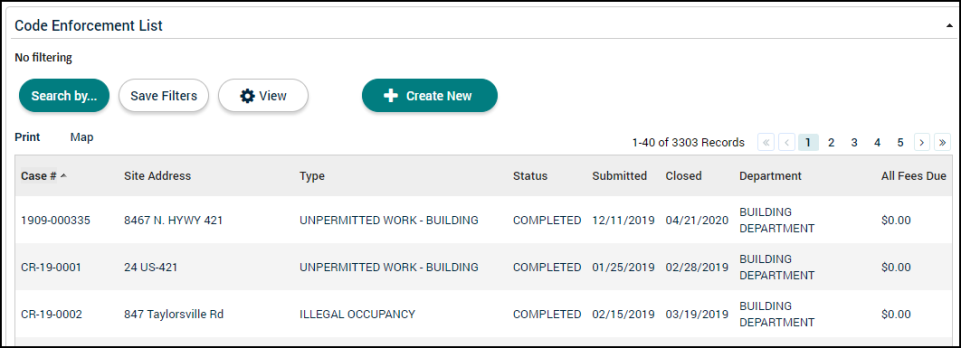
Code enforcement list
This widget displays a list of all Code Enforcement Cases within SmartGov.
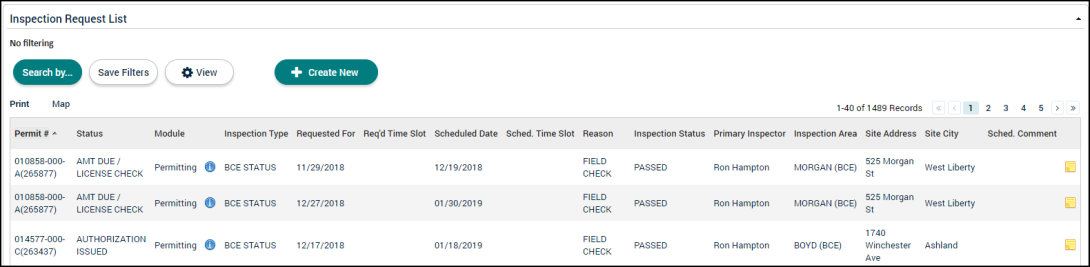
Inspection request list
This widget displays a list of all Inspection Request records within SmartGov.
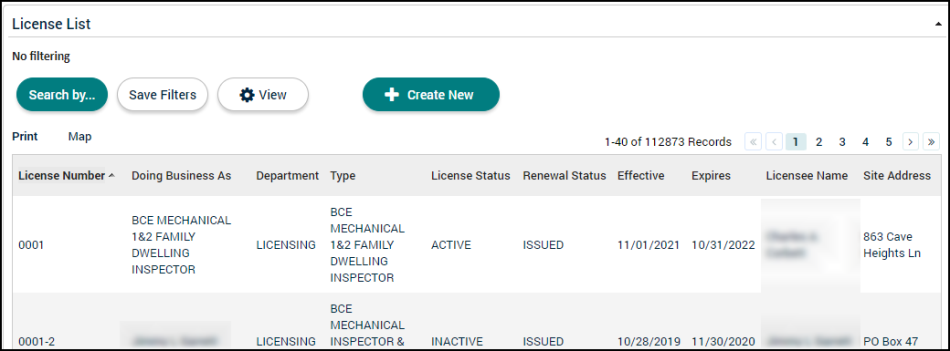
License list
This widget displays a list of all Licenses within SmartGov.
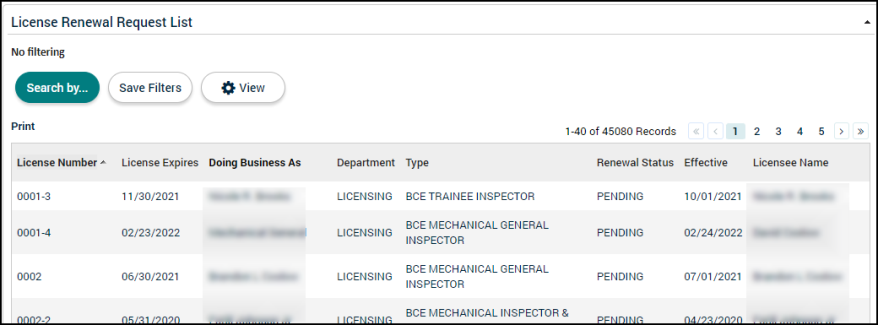
License renewal request list
This widget displays a list of all License Renewal records within SmartGov.