Creating KPIs
Key Performance Indicators are quantifiable measurements that show how effectively your organization is achieving key business objectives. They are commonly used to evaluate the level of success of a particular activity or progress toward a desirable goal. Asset Essentials provides you with the ability to create custom KPIs that can be viewed from your Dashboard.
Creating a new KPI
- Click on the Admin menu icon, then select Configurations.
- Under the Misc section, select KPIs.
- Here you will see a list of the KPIs in your account.
- Click the New button.
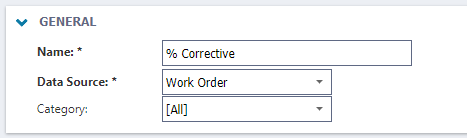
General
- Enter a Name for the KPI.
- Select the Data Source from the drop down. The Data Source determines what data fields can be used to create the KPI.
- If you have already created KPI Categories, select a Category if necessary.
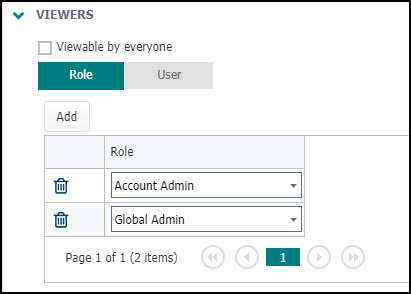
Viewers
This section determines who can view this KPI. Once this section has been set up, each user that has access to the KPI will need to apply that KPI to their individual dashboard in order to view it.
- If you would like the KPI to be viewable by any user with the appropriate permissions check the Viewable by everyone box.
- To make the KPI only viewable to specific roles, make sure the Role option is selected.
- Click the Add button.
- Select the Role that should be able to view this KPI from the drop down.
- Click the Add button again to allow multiple roles access to view this KPI.
- To make the KPI only viewable to specific users, make sure the User option is selected.
- Click the Select User icon (
 ).
). - In the Select User window, check the boxes next to the users that you would like to be able to view this KPI.
- Click the Select button
- Click the Select User icon (
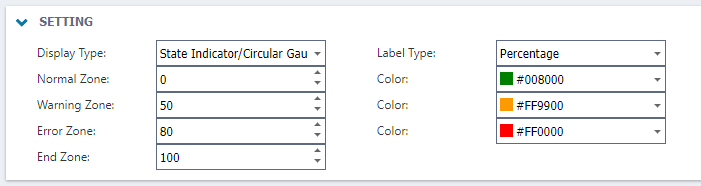
Setting
The Setting section controls the look of the KPI and allows you to set the ranges for the KPI states or zones.
- In the Display Type field, select the KPI style from the drop down.
- State Indicator - This option presents the KPI as a stop light with either the green, yellow, or red light shining to represent the state of the KPI determined by the parameters set in this section.
- Circular Gauge - This option presents the KPI as a gauge similar to a car's odometer.
- State Indicator/Circular Gauge - This option shows the KPI as a gauge with colored markings indicating the state of the KPI determined by the parameters set in this section.
- Select the Label Type as Number or Percentage.
- The Zone fields in this section allow you to set the standard ranges for the state or health of the KPI.
- To set the range for a normal KPI value, enter the starting value in the Normal Zone field and set the ending value in the Warning Zone field. When the KPI is calculated, the result will be considered Normal if the calculated result falls between these two values. Depending on the Display Type selected in this section, you may be able to choose a Color to represent this range.
- To set the range for a KPI value that may be a warning sign for corrective action, enter the ending value in the Error Zone field. The starting value for this range was set in the Warning Zone field in the previous step. When the KPI is calculated, the result will be considered a warning sign for corrective action if the calculated result falls between these two values. Depending on the Display Type selected in this section, you may be able to choose a Color to represent this range.
- To set the range for a KPI value that requires evaluation, enter the ending value in the End Zone field. The starting value for this range was set in the Error Zone field in the previous step. When the KPI is calculated, the result will be considered in need of critical attention if the calculated result falls between these two values. Depending on the Display Type selected in this section, you may be able to choose a Color to represent this range.
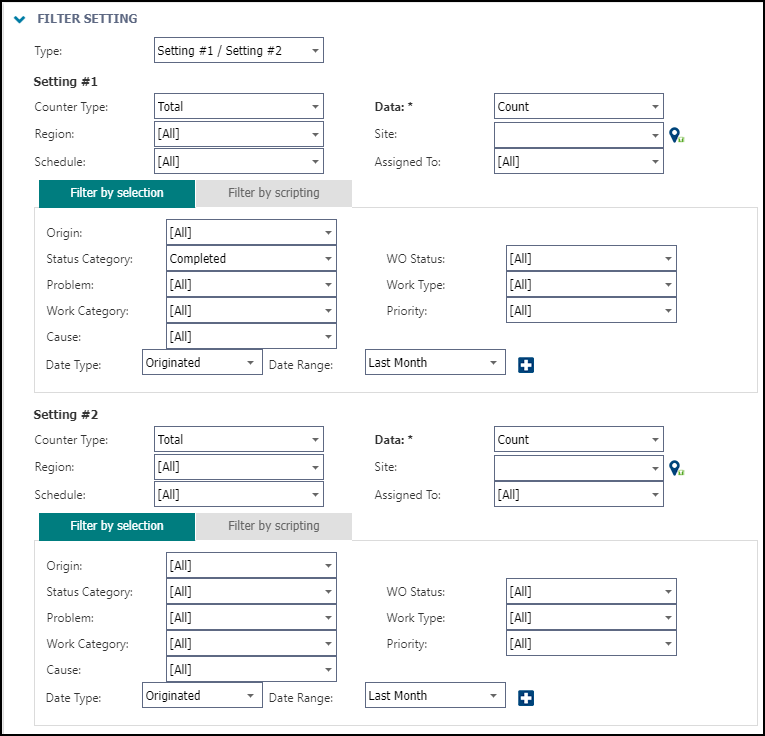
Filter Setting
This section allows you to filter the data in your account to create the KPI calculation.
- Choose a Type from the drop down.
- Select Setting #1 if you would like the KPI to be focused on a particular data point.
- Select Setting #1 / Setting #2 if you would like to compare two data points. Selecting this option will add additional fields to this section.
- Under the Setting #1 header, choose the Counter Type of Total or Average.
- Select the Data field from the drop down. *Note: The options that appear in this field are determined by the Data Source selected in the General section.
- If the KPI should only represent a Region or Site select the appropriate option from the drop down.
- If the KPI is focusing on "on time" completion use the Schedule field to select work orders with expected dates earlier than today's date or earlier than the completion date.
- Choose whether the KPI should be focused on yourself or everyone in the Assigned To field.
- The next section allows you drill-down the data by applying various filters. You can choose to Filter by selection or Filter by scripting. *Note: We recommend you use the default Filter by selection option if you do not have experience in writing scripting expressions.
- Select information in the fields to filter your data.
- If you selected the Type of Setting #1 / Setting #2, enter the information you would like Setting #1 to be compared to under the Setting #2 header. This is commonly used to calculate percentages such as the number of completed work orders in a month (Setting #1) compared to the total work orders originated in a month (Setting #2).
- Click the Save button to add the KPI to Asset Essentials.