Creating charts
Charts provide a high-level overview of your work orders. For example, you can create a chart to see the number of work orders that are in certain statuses or categories for a specific region or site. A chart is unique to each user's profile and cannot be shared between users. Asset Essentials provides you with the ability to create charts that can be viewed from your Dashboard.
Creating a new chart
- Click on the Profile icon on the top-right corner of the page.
- Select My Charts. Here you will see a list of charts that are added to your account.
- Click the New button.
General
- Click on the wrench icon (
 ) beside the Name field.
- From the list of charts that display, click the arrow on the left to select a chart.
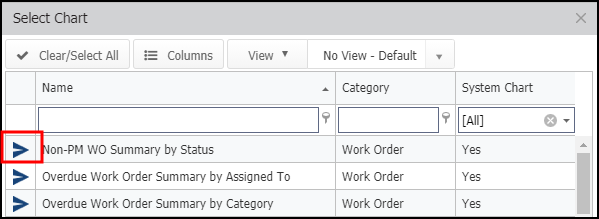
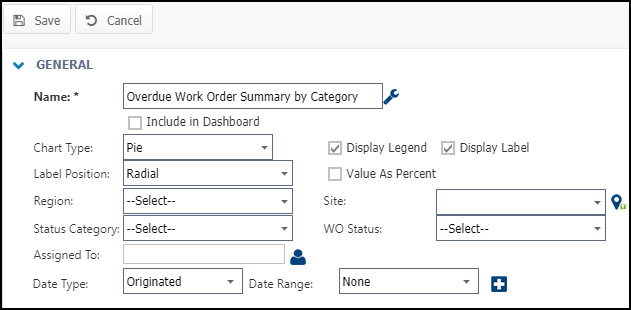
- Edit the name of the chart in the Name field to give it a unique name. By default, the name of the chart you selected appears.
- Check Include in Dashboard to display the chart in the Chart element on your Dashboard. *Note: Make sure that there is sufficient space in the Charts section on your Dashboard to be able to view all the charts that you choose. We suggest that charts with a lot of data remain under the My Charts page.
- Select an appropriate chart type from the Chart Type drop-down based on your requirements.
- If not already selected, select the Display Legend check-box to display the categories of data that is reflecting on the chart.
- If not already selected, select the Display Label check-box to display the numeric values for each data point on a graph.
- Select the position of where you want your label to display from the Label position drop-down.
-
Check Value As Percent to view the data values on your chart in percentage values (%). By default, the Pie and Doughnut chart type displays the data in percentage values.
- Use the following filter options to filter the data that should display on the chart:
- Region: Select the region from the drop-down to view the chart for a specific region.
- Site: Select the sites within the region that you want to display on the chart.
Status Category: Select the WO category for which you want to view data.
WO Status: Select the WO status for which you want to view data.
Assigned To: To make the chart display data for specific users:
Click the Select User icon (
 ).
). - Check the boxes next to the users in the Select User window that you would like to be able to view this chart.
- Click the Select button.
Date type: Select the appropriate date type for your chart.
- Date Range: Select the date range that you want your chart to populate. You must select a date range if you have selected a Date type.
- Click the plus icon (
 ) to select multiple date range and date types.
- Click the plus icon (
-
Click Save. The new chart will display under the My Charts list. You can click on the chart name to view the chart and click on the data within the chart to go to the corresponding work order data.
Editing a chart
After you create a chart, you can edit the chart settings if needed.
- Click on the Profile icon in the top-right corner of the page.
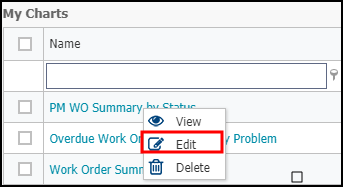
- Select My Charts. Here you will see a list of charts that are already added to your account.
- Right-click on the chart that you want to edit and click Edit.
- Update the chart information in the General section.
- Click Save. You can click on the chart name to view the chart and click on the data within the chart to go to the corresponding work order data.
Deleting a chart
After you create a chart, you can delete the chart if needed. This removes the chart from your profile and the Dashboard.
- Click on the Profile icon in the top-right corner of the page.
- Select My Charts. Here you will see a list of charts that are already added to your account.
- Right-click on the chart that you want to delete and click Delete.