KPIs
Analytics provides Key Performance Indicators. KPIs are quantifiable measurements that show how effectively your organization is achieving key business objectives and compare your performance to peers in your industry. They are commonly used to evaluate the level of success of a particular activity or progress towards a desirable goal. These KPIs report on volume of work, efficiency, and data quality. *Note: Not all clients are eligible for Analytics. To learn if you are eligible, contact Client Services.
The KPIs are updated every month and include a rolling 12 months worth of data. For example, if you are viewing your KPIs in March, you will see data from the first of March of the previous year through the end of February of the current year.
Learn how to improve your KPI scores.
Exporting graphs
- To export an individual graph into a CSV file, PDF file, or image, click on the export icon (
 ) in the top right corner of the graph and select Export CSV, Export PDF, or Export Image.
 - To export all of the KPI data graphs on your screen into Excel spreadsheets, click on the Export All icon (
 ) in the top right corner of the page.
Volume KPIs
Volume KPIs show work order counts according to different metrics.
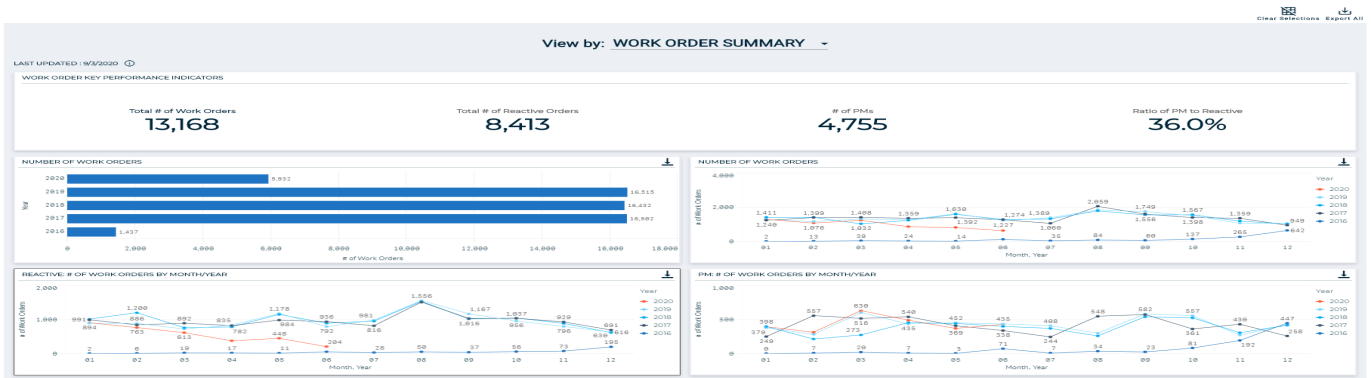
Work order summary
This KPI allows you to see work order counts to get a snapshot of your operations across your organization and compares them to similar organizations.
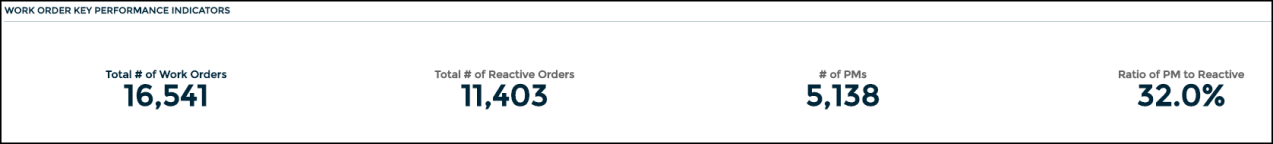
Work Order Key Performance Indicators
Displays the total number of work orders, reactive work orders, PM work orders, and a ratio of PM to reactive work orders created in the past 12 months.
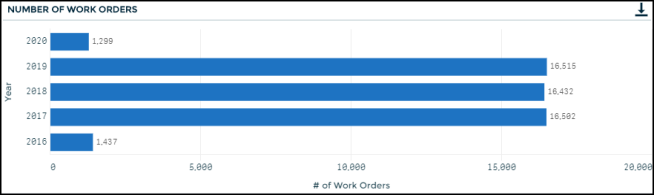
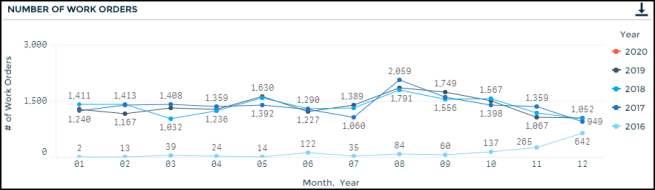
Number of Work Orders
Displays the total number of all work orders broken out by month and year.
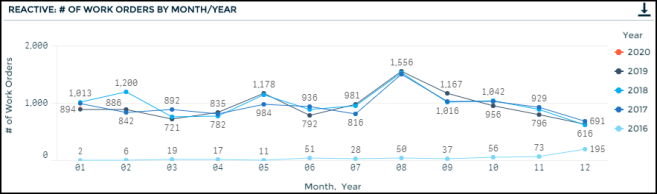
Reactive: # of Work Orders by Month/Year
Displays the total number of reactive work orders broken out by month and year.
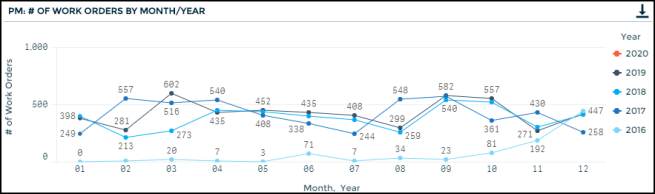
PM: # of Work Orders by Month/ Year
Displays the total number of PM work orders broken out by month and year.
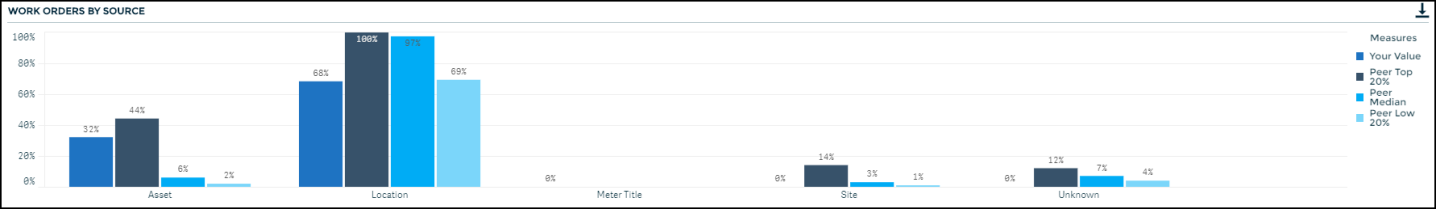
Work Orders By Source Type
Displays the percentage of work orders created with the source type of Asset, Location, Meter Title, Site and Unknown in the past 12 months.
This section displays your value.
This section displays peers in the top 20%.
This section displays peers that are performing in the median.
This section displays peers that are performing in the bottom 20%.
Average work orders per individual
This KPI allows you to view work order averages across your organization and compares them to similar organizations in order to evaluate workload and efficiency.
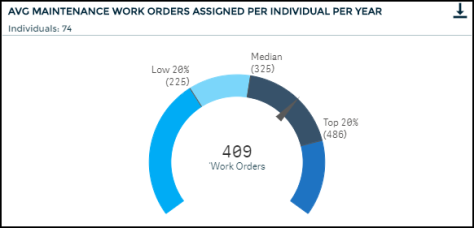
Avg Maintenance Work Orders Assigned Per Individual Per Year
Displays the average number of all work orders assigned to an individual in the last 12 months. *Note: For an individual to be included in this graph, they must have at least 30 but less than 2000 work orders assigned to them.
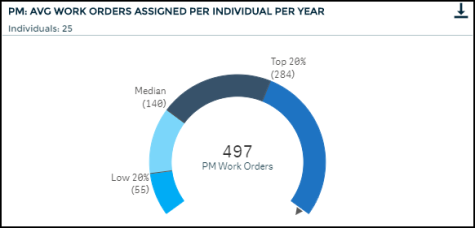
PM: Avg Work Orders Assigned Per Individual Per year
Displays the average number of PM work orders assigned to an individual in the last 12 months. *Note: For an individual to be included in this graph, they must have at least 30 but less than 2000 work orders assigned to them.
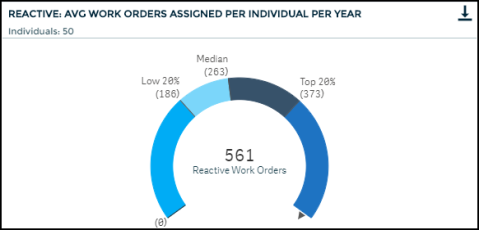
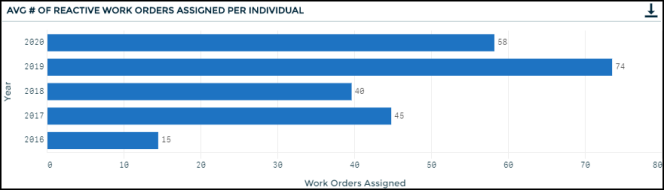
Reactive: Avg Work Orders Assigned Per Individual Per Year
Displays the average number of reactive work orders assigned to an individual in the last 12 months. *Note: For an individual to be included in this graph, they must have at least 30 but less than 2000 work orders assigned to them.
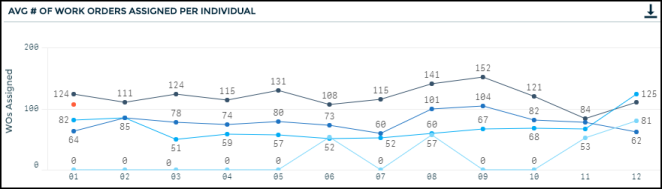
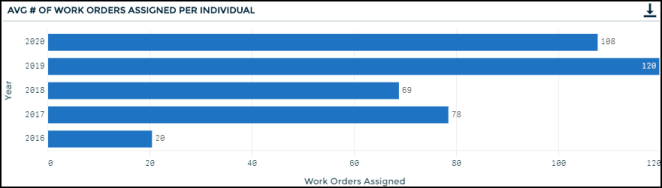
Avg # of Work Orders Assigned Per Individual
Displays the average number of all work orders assigned to employees in the last 12 months broken out by months and years. *Note: For an employee to be included in this graph, they must have at least 30 but less than 2000 work orders assigned to them.

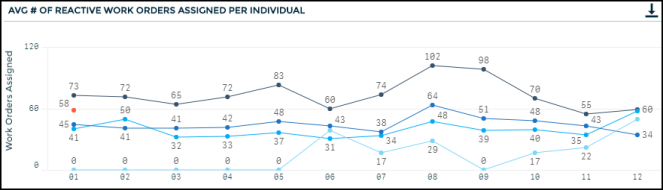
Avg # of Reactive Work Orders Assigned Per Individual
Displays the average number of reactive work orders assigned to employees in the last 12 months broken out by months and years. *Note: For an employee to be included in this graph, they must have at least 30 but less than 2000 work orders assigned to them.
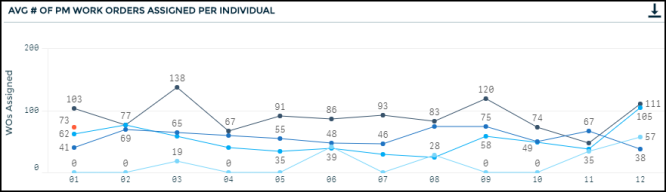
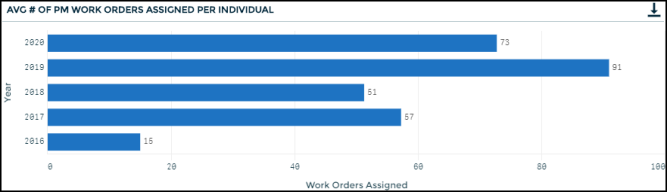
Avg # of PM Work Orders Assigned Per Individual
Displays the average number of PM work orders assigned to employees in the last 12 months broken out by months and years. *Note: For an employee to be included in this graph, they must have at least 30 but less than 2000 work orders assigned to them.
Hours spent on work
This KPI allows you to view trends of hours spent on work orders year-over-year across your organization and compares them to similar organizations.
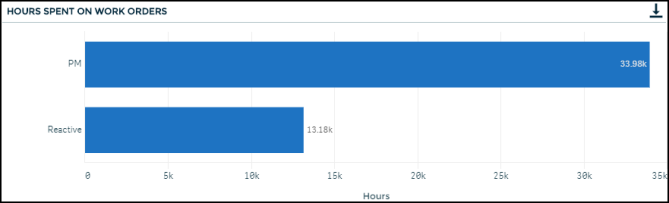
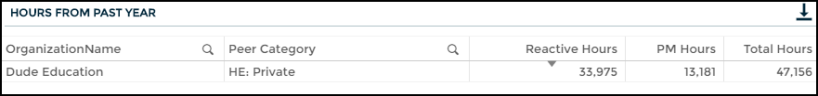
Hours Spent on Work Orders
Displays the number of hours spent on all work orders over the past 12 months.
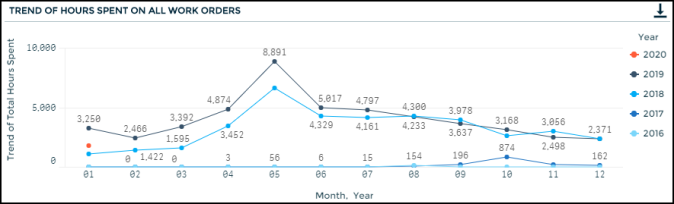
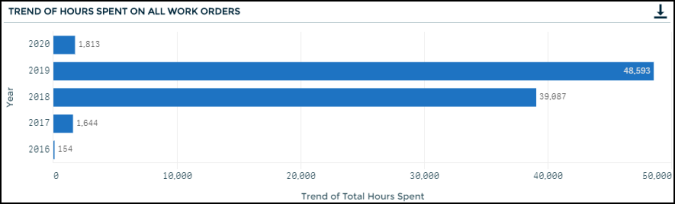
Trend of Hours Spent on All Work Orders
Displays the trend of hours spent on all work orders broken down by month and year.
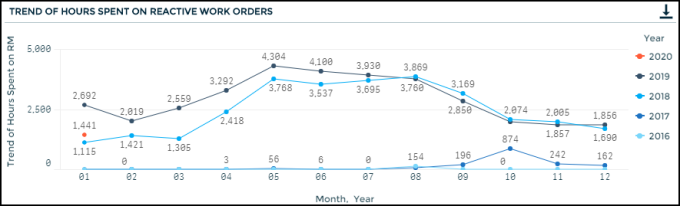
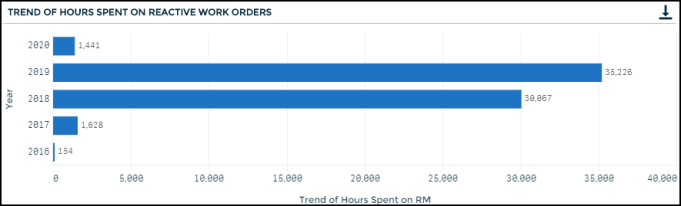
Trend of Hours Spent on Reactive Work Orders
Displays the trend of hours spent on reactive work orders broken down by month and year.
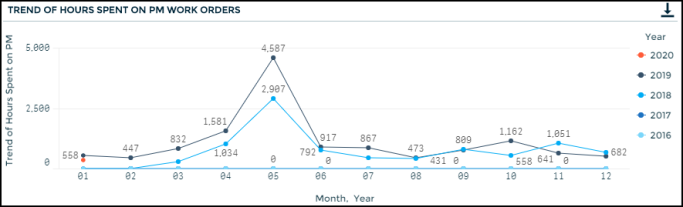
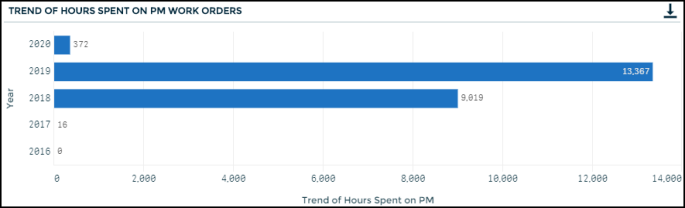
Trend of Hours Spent on PM Work Orders
Displays the trend of hours spent on PM work orders broken down by month and year.
Work orders per square foot
This KPI allows you to see how work orders are broken down in relation to your organization’s square footage and compares them to similar organizations.
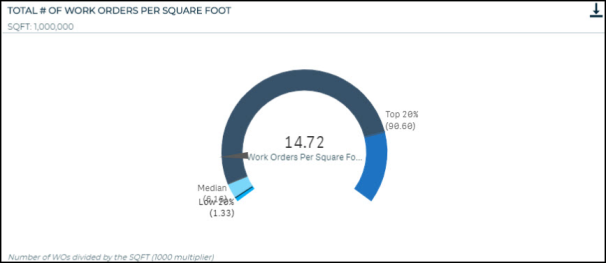
Total # of Work Orders Per Square Foot
Displays the number of all work orders divided by the total square footage of your Locations. On the graph, you will see a small indicator that represents where your organization is performing compared to peers in your industry. Your value will be displayed in the middle of the graph. *Note: You must have square footage entered on your Locations and the total sum of your square footage must be greater than or equal to 1,000 for this KPI to calculate correctly.

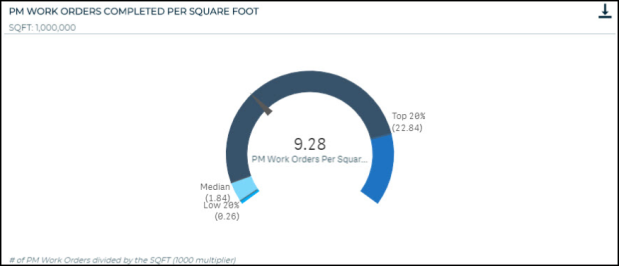
PM Work Orders Completed Per Square Foot
Displays the number of work orders generated from PMs divided by the total square footage of your Locations. On the graph, you will see a small indicator that represents where your organization is performing compared to peers in your industry. Your value will be displayed in the middle of the graph. *Note: You must have square footage entered on your Locations and the total sum of your square footage must be greater than or equal to 1,000 for this KPI to calculate correctly.

Work orders per enrollment
This KPI allows you to see how work orders are broken down in relation to your organization’s enrollment and compares them to similar organizations.
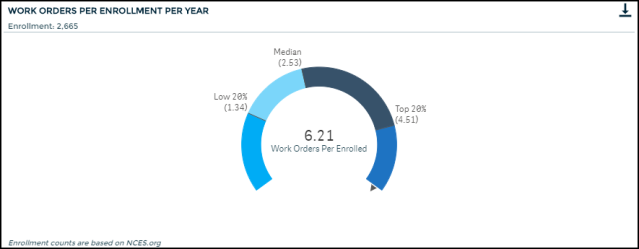
Work Orders Per Enrollment Per Year
Displays the number of all work orders entered in the past 12 months divided by your student enrollment from the National Center for Education Statistics (NCES) database. On the graph, you will see a small indicator that represents where your organization is performing compared to peers in your industry. Your value will be displayed in the middle of the graph.

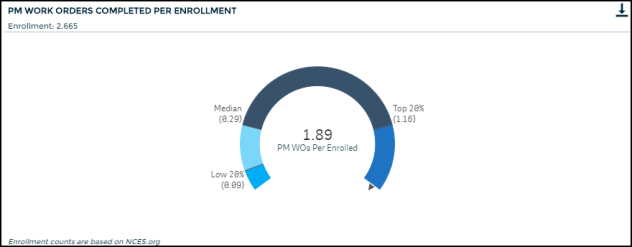
PM Work Orders Completed Per Enrollment Per Year
Displays the number of work orders generated from PMs in the past 12 months divided by your student enrollment from the National Center for Education Statistics (NCES) database. On the graph, you will see a small indicator that represents where your organization is performing compared to peers in your industry. Your value will be displayed in the middle of the graph.

Efficiency KPIs
Efficiency KPIs show how well your organization is performing according to specific metrics.
Response time to complete work
This KPI allows you to see how your organization is responding to work orders compared to similar organizations.
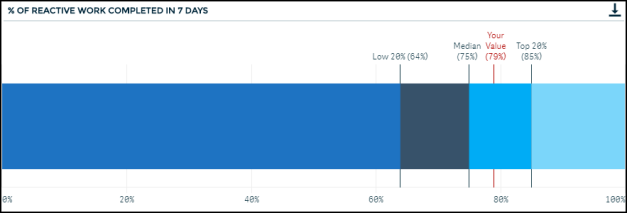
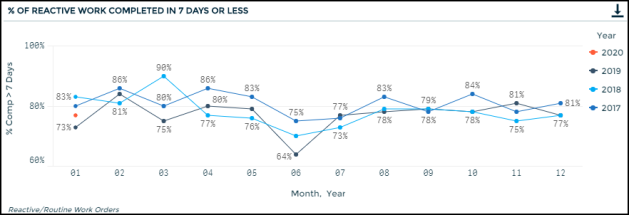
% of Reactive Work Completed in 7 Days or Less
This percentage shows the number of reactive work orders that were completed in 7 days or less divided by the total number of reactive work orders that were completed in the past 12 months. A work order is considered completed if the Status Category of the work order is ‘Completed’ or ‘Archived’. Your organization's percentage will be located just below the data line in larger black text.


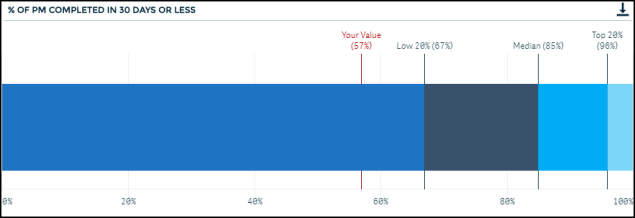
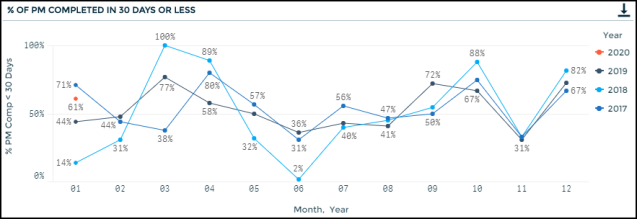
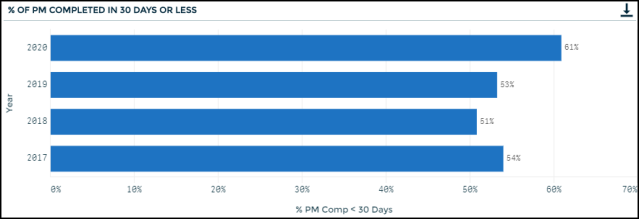
% of PM Completed in 30 Days or Less
This percentage shows the number of PM work orders that were completed in 30 days or less divided by the total number of PM work orders that were completed in the past 12 months. A work order is considered completed if the Status Category of the work order is ‘Completed’ or ‘Archived’. Your organization's percentage will be located just below the data line in larger black text.

Average hours per week
This KPI allows you to view hours spent on work order averages across your organization and compares them to similar organizations to evaluate workload and productivity.
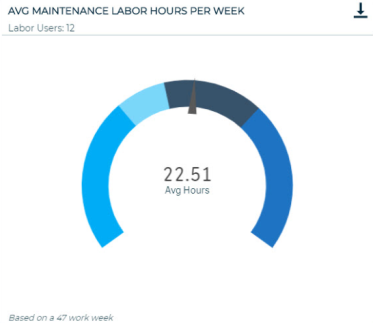
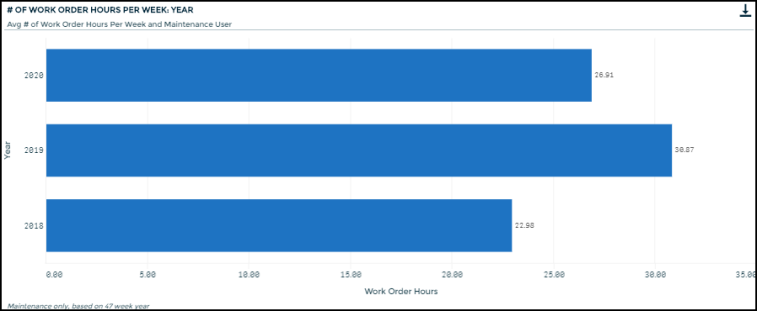
Avg Maintenance Labor Hours Per Week
Displays the average number of weekly employee hours on all work orders for the past 12 months based on a 47 week year. *Note: Employees must have between 500 and 3000 labor hours entered during the 12 month time period to be included in this KPI.

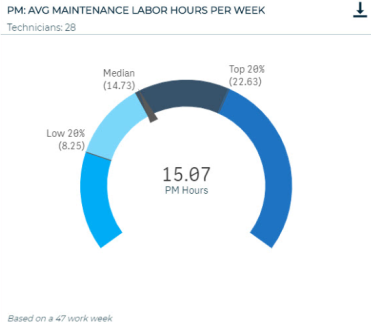
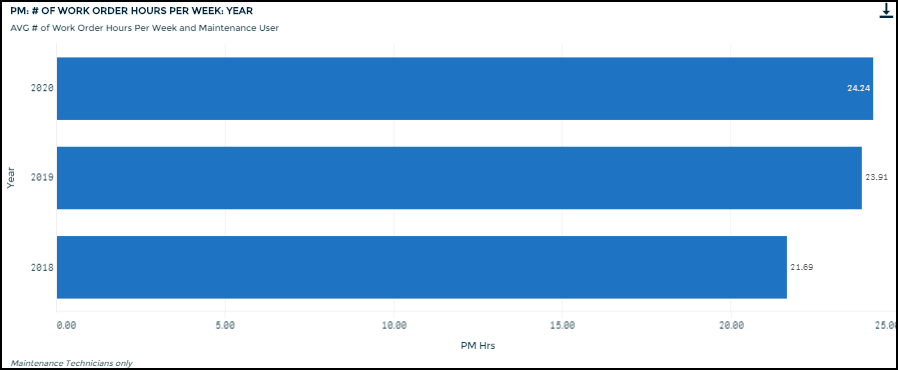
PM: Avg Maintenance Labor Hours Per Week
Displays the average number of weekly employee hours on PM work orders for the past 12 months based on a 47 week year. *Note: Employees must have between 500 and 3000 labor hours entered during the 12 month time period to be included in this KPI.
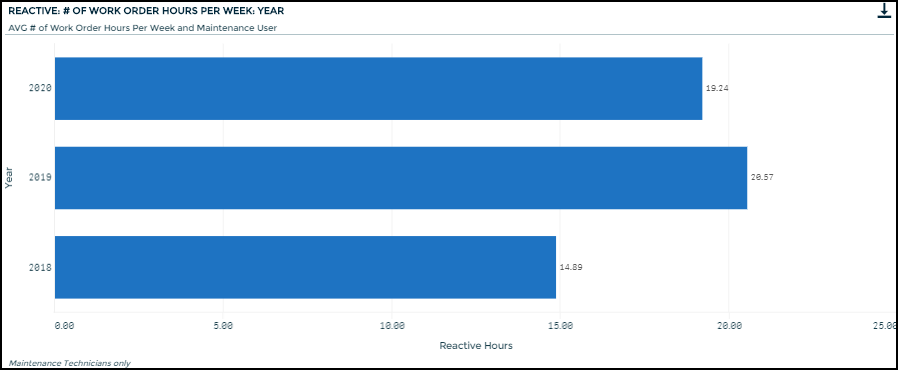
Reactive: Avg Maintenance Labor Hours Per Week
Displays the average number of weekly employee hours on reactive work orders for the past 12 months based on a 47 week year. *Note: Employees must have between 500 and 3000 labor hours entered during the 12 month time period to be included in this KPI.

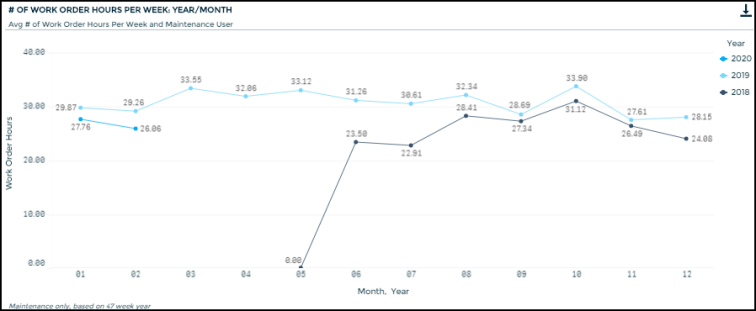
Avg # of Work Order Hours Per Week: Year/Month
Displays the average number of weekly employee hours on all work orders for the past 12 months based on a 47 week year. These graphs are broken down by month and year. *Note: Employees must have between 500 and 3000 labor hours entered during the 12 month time period to be included in this KPI.
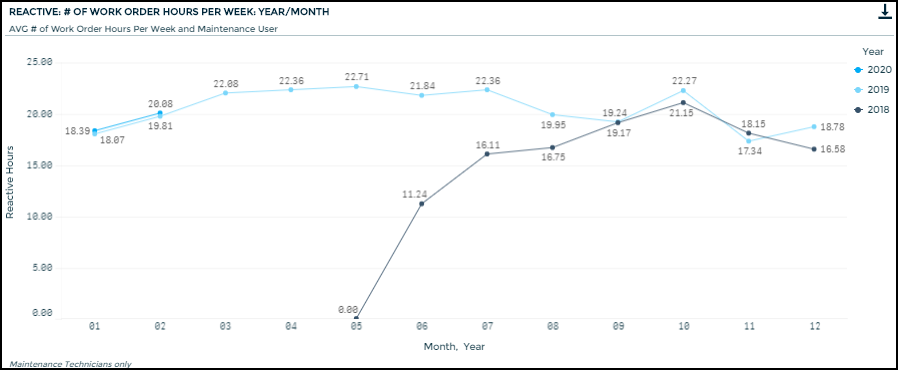
Reactive: Avg # of Work Order Hours Per Week: Year/Month
Displays the average number of weekly employee hours on reactive work orders for the past 12 months based on a 47 week year. These graphs are broken down by month and year. *Note: Employees must have between 500 and 3000 labor hours entered during the 12 month time period to be included in this KPI.
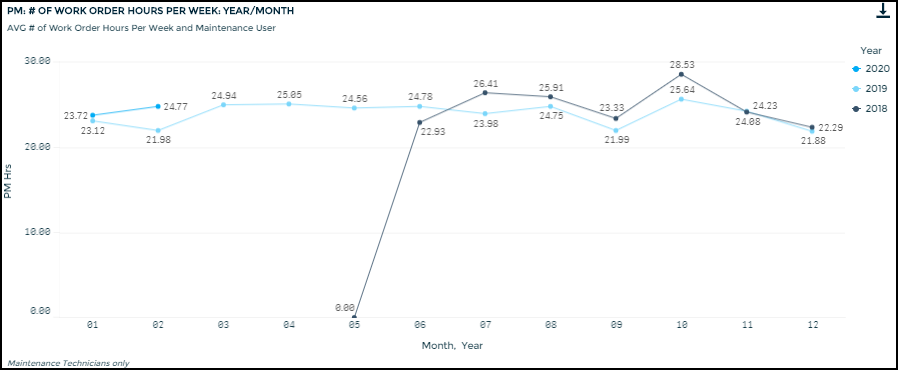
PM: Avg # of Work Order Hours Per Week: Year/Month
Displays the average number of weekly employee hours on PM work orders for the past 12 months based on a 47 week year. These graphs are broken down by month and year. *Note: Employees must have between 500 and 3000 labor hours entered during the 12 month time period to be included in this KPI.
PM to RM ratio
This KPI allows you to see how work orders are broken down in relation to planned vs reactive maintenance and compares them to similar organizations.
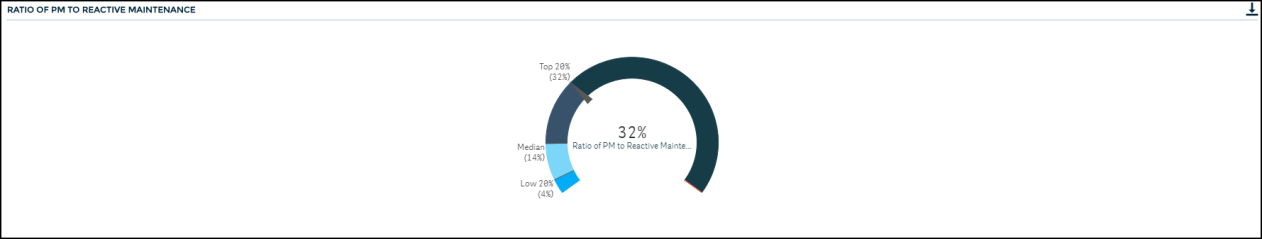
Ratio of completed PM to Reactive Maintenance
Displays the percentage of completed PM work orders in the past 12 months divided by the total number of completed work orders in the same period. A work order is considered completed if the Status Category of the work order is ‘Completed’ or ‘Archived’.

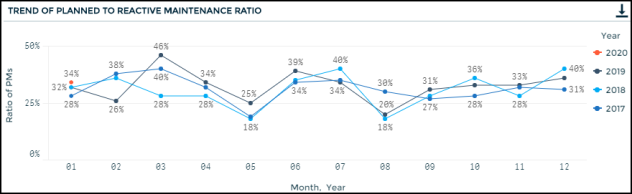
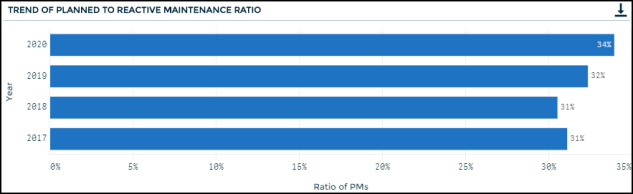
Trend of Planned to Reactive Maintenance Ratio
Displays a trend of completed PM work orders in the past 12 months divided by the total number of completed work orders in the same period broken out by month and year. A work order is considered completed if the Status Category of the work order is ‘Completed’ or ‘Archived’.
Work order completion
This KPI allows you to view completion details on work orders across your organization and compares them to similar organizations.
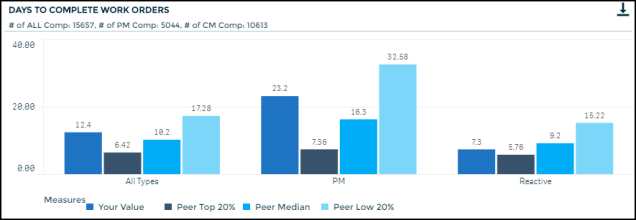
Days to Complete Work Orders
Displays the number of days it took to complete PM work orders, reactive work orders, and both combined. This number is calculated by subtracting the Date Assigned from the Date Completed on completed work orders in the past 12 months and ignores work orders with an age of less than 0 and greater than 365 days. A work order is considered completed if the Status Category of the work order is ‘Completed’ or ‘Archived’.
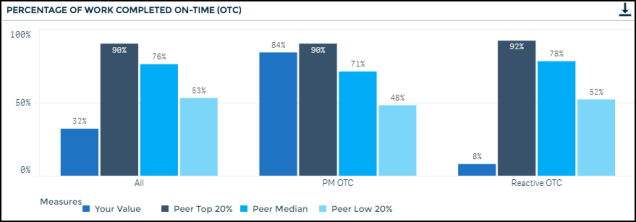
Percentage of Work Completed On-Time (OTC)
Shows the on time completion percentage for reactive maintenance work orders, PM work orders, and both combined for the past 12 months. A work order is considered on time if it has been completed by the Date Expected as recorded on the work order form. If the work order is completed after this date, it is considered not completed on time.
Data quality KPI
Data Quality KPIs show what percentage of your work orders have quality data entered compared to your peers. The fields included in this KPI are Cause, Cost, Cost Center, Hours, Priority, Problem, Work Category, and Work Type.
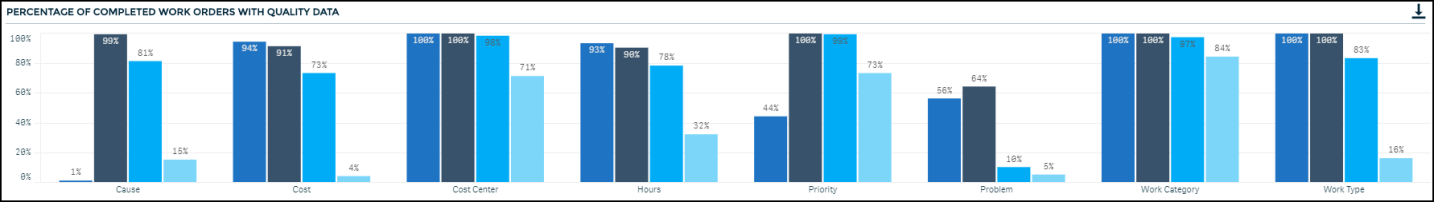
Work order data quality
This KPI allows you to gain insight into the data quality of your work orders to identify where you have opportunities to improve data collection. It displays the percentage of all work orders that reach an acceptable data quality standard broken up by the following 8 fields: Cause, Cost, Cost Center, Hours, Priority, Problem, Work Category, and Work Type.