Forecast
Forecast is a dashboard that analyzes your historical data to provide an expectation of your future workload. The forecasts present a twelve month projection of your Created Work Order metrics and your Completed Work Order metrics. This will help you to budget and plan with confidence by using your historical data to guide conversations within your organization about allocating funds where they are needed most. *Note: Not all clients are eligible for Analytics. To learn if you are eligible, contact Client Services.
The forecasts are driven by patterns found in your work order data over the previous 36 months, including:
- Evidence of an upward or downward trend over time
- Seasonal influence (For example, high volumes in August)
- Historical volatility
Glossary
- Forecast: An estimation of a future trend.
- Series: Refers to a time series, which is a series of data points listed in order by time.
- Model: Refers to a statistical or mathematical model. In its most general form, a model is a representation of something. In the mathematical context, a model is usually an equation that describes a relationship and make an estimation of an unknown data point. In this case, the models describe the relationship between work orders in the past to estimate work orders in the future.
- MAPE (Mean Absolute Percent Error): A metric commonly used to determine the accuracy of a forecast. It is calculated by taking the average of the absolute percent error comparing the modeled value to the actual value for each time period.
- Eligibility: Refers to whether or not a client’s data meets the necessary criteria to have a forecast. Any data series can be used to produce a forecast, but the eligibility criteria are in place to help determine which forecasts are trustworthy representations of the data.
- Dashboard Statistics: Metrics that summarize and compare work order counts over the last twelve months to forecasted work order counts over the next twelve months.
- Trending Display: A chart that shows the pattern in both the past twelve months of work order data, as well as the next twelve months of data forecasts.
Eligibility
The goal of the forecast is to generate predictions that will be as close as possible to the actual values over the next twelve months. Therefore, we have implemented eligibility criteria that must be met to receive a forecast. Ineligibility to receive the forecast is typically driven by one of the following criteria:
- Not enough data - There must be 36 months of historical data. If there is one month missing for any reason, a forecast will not be created.
- Extreme Values/Structural Changes - Accounts will be ineligible if a series includes large spikes or odd patterns because these can influence the forecasts going forward.
- Weak patterns - We use the MAPE (Mean Absolute Percent Error) statistic to select models that identify strong statistical patterns. Setting a MAPE threshold helps to provide forecasts that we are confident in.
We choose strict eligibility criteria in order to provide reliable forecasts. However, we also refresh the forecast every month to provide as many up to date forecasts as possible. Eligibility criteria for created work orders is separate from eligibility criteria for completed work orders, meaning that you can be eligible for one and not the other. The reference date in the table on the dashboard indicates the date that the forecast begins. The reference date will always represent the most recent date that you were eligible to receive a forecast. Also, you can have different reference dates for each forecast. For example, if in April 2020 you were eligible for both forecasts, but when the model was run again in May 2020, your completed work orders were missing which made you ineligible for your completed work order forecast in May 2020. Your dashboard would then show the completed work order forecast for the months of April 2020 through March 2021 and your created work order forecast for the months of May 2020 through April 2021.

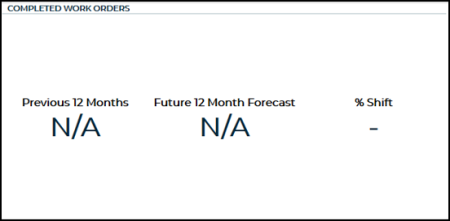
If you are ineligible for one forecast, the statistics and trending information will have values of “N/A” as shown below.
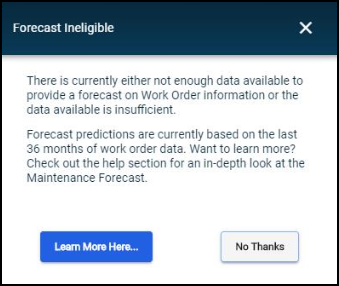
If you are ineligible for both forecasts, you will receive the following message.
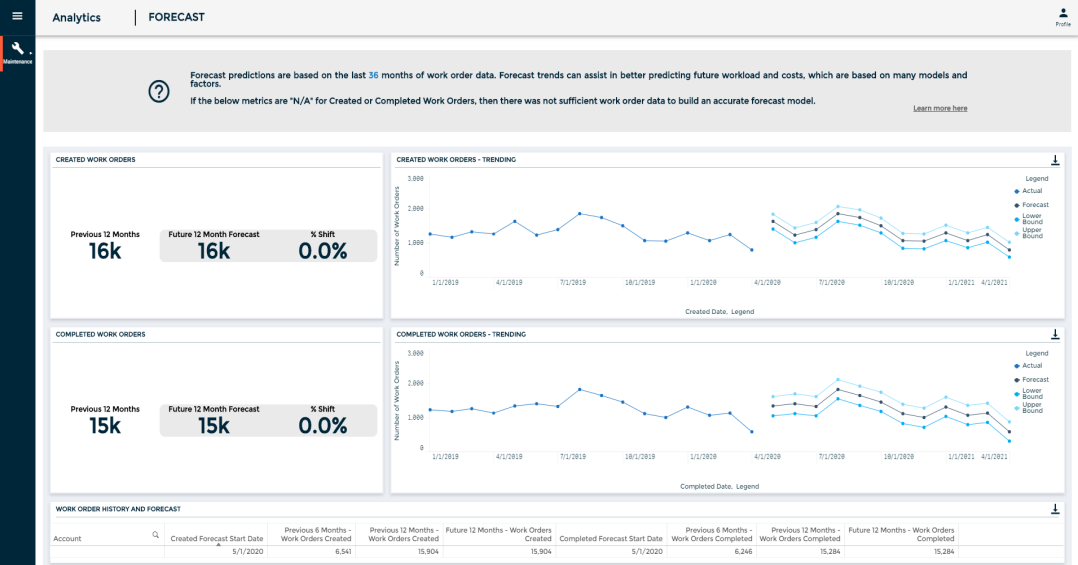
Dashboard
The forecast values are based solely on statistically significant patterns found in the historical data. It does not specifically take into account external factors, like business strategy changes, unexpected emergencies, or system updates, though the effect that these have on the historical data can influence the forecasts. We take steps to ensure that the models we use display strong accuracy metrics on the past data, but cannot say with certainty that they will be accurate into the future. It is worth noting that the effect of the COVID-19 pandemic on created and especially completed work orders may influence forecasts into the future, but forecasts will continue to be refreshed monthly and the forecasts will adjust as new workflow patterns emerge and begin to normalize.
The Maintenance Forecast dashboard includes the following:
- A short overview of the Maintenance Forecast
- Statistics and trends for created work orders
- Statistics and trends for completed work orders
- A table detailing the created and completed work order metrics
The forecasts are refreshed on a monthly basis, so that the projections take into account any recent changes in the historical data.
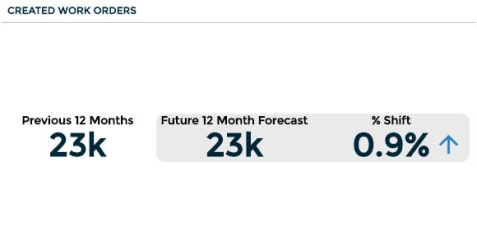
Statistics
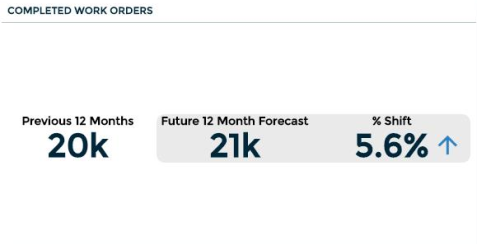
The statistics include a rolling sum, rounded to the thousands of the previous twelve months, the next twelve months according to the forecast, and the percentage change between those two metrics. *Note: Since the statistics are rounded to the thousands, it may appear that there is no shift if the values match, but from a work order count perspective, there may actually be a shift in percentage. For precise work order counts, see the Work Order History and Forecast Table below.
Created Work Orders
Completed Work Orders
Trending display
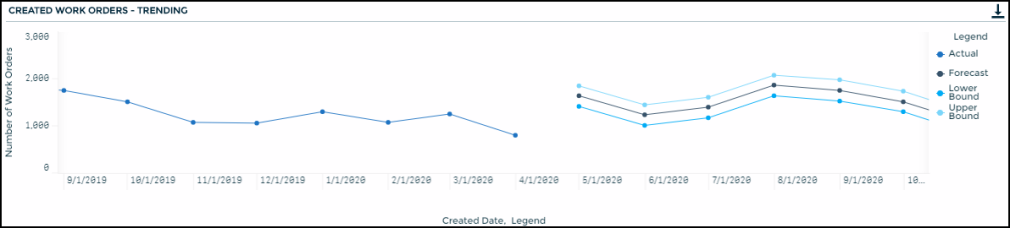
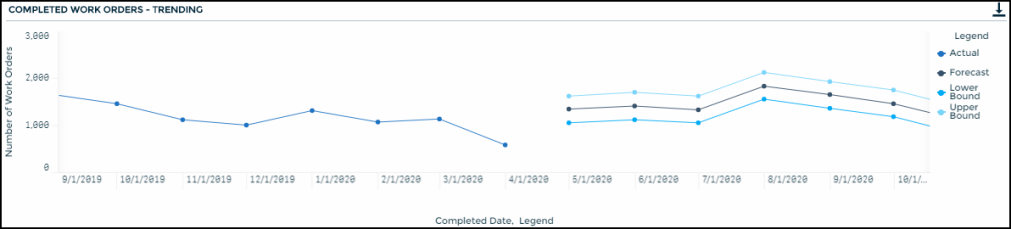
The trends include the past twelve months and the forecast for the next twelve months, as well as a lower bound and an upper bound. The lower bound and the upper bound represent an 80% prediction interval around the forecast. This can be interpreted as an interval within which we expect the true value to fall with an 80% probability, as long as historical trends continue.
Created Work Orders
Completed Work Orders
Work Order History and Forecast
This table includes the specific metrics for created and completed work orders. It also references the forecast start dates for those metrics. For example, if the Created Forecast Start Date is May 1, 2020, this means the past 12 months includes data from May 1, 2019 through April 30, 2020 and the next 12 months forecast includes data from May 1, 2020 through April 30, 2021.