Filtering, exporting, and sharing
The dashboards and KPIs available in Analytics pull data directly from your Asset Essentials account and present it in tables and graphs to help you easily see snapshots of the work taking place at your organization. You are able to filter your data to see exactly what you need, export the data to use in presentations or other applications, and share your dashboards with other users. *Note: Not all clients are eligible for Analytics. To learn if you are eligible, contact Client Services.
Filtering the dashboard
- You can filter the dashboard you are on using the Filter options on the left side of the screen. There are various ways you can see what is being filtered:
- Your selections will appear along the top of the screen as tags.
- A bar will display under each field that is being filtered, depending on your selections.
- The number next to the each field indicates how many selections you have filtered. *Note: There is a maximum of 50 selections per filter option.
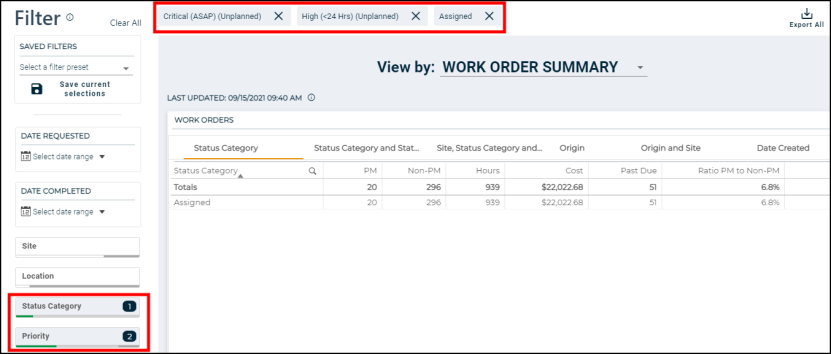
- To save your filter selections, click Save current selections in the Saved Filters box.
- Select a saved filter from the drop-down menu in the Saved Filters box to apply it to the dashboards.
- To clear your filter selections, click Clear All above the filter options or click the "X" next to any individual tags at the top of the dashboard.
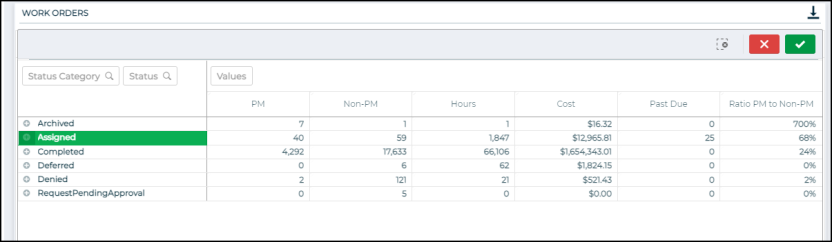
- Within each chart or section of the dashboard, you can make selections to narrow down the data.
- Select the information in the graph or table you want to view and click the green checkmark. The rest of the charts and tables on the dashboard you are viewing will be filtered by those selections.
Exporting tables and graphs
You can export any table or graph on the Dashboard and KPI pages to use in presentations or other applications.
- To export an individual table or graph into a CSV file, PDF file, or image, click on the export icon (
 ) in the top right corner of the table/graph and select Export CSV, Export PDF, or Export Image.
 - To export all of the dashboard or KPI data on your screen into a CSV file, click on the Export All icon (
 ) in the top right corner of the page. *Note: The Export All option will not work on dashboards with multiple tabs, such as the Work Order Summary or the Utilization Dashboard, but you can still export the individual tables and charts on those dashboards.
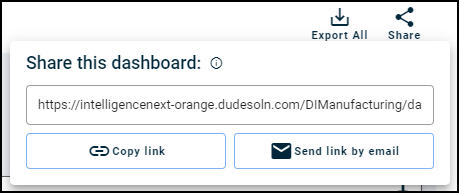
Sharing a dashboard
In order to share a filtered dashboard, you must share it with another Analytics user who has the permission to view dashboards. This will share up to 50 filters set on the individual graphs and in the Filter section on the left side of the page. If the user is already logged into Analytics, they will see the dashboard after clicking the link you shared. If the user is not already logged into Analytics, they will be required to login before viewing the dashboard you shared.
- To share a filtered dashboard with another Analytics user, click on the share icon (
 ) in the top right corner of the page.
 - You have two options for sharing the dashboard:
- Copy link: Click this button to copy the link to your clipboard. You can then paste the link wherever it is most convenient to share it with another user.
- Send link by email: Click this button to open a pre-filled email template using your default email account. *Note: The default email account is configured within the mail-to settings in your browser.