Back to Energy Manager Main Menu
Carbon emissions reports
Carbon Emissions Reports help you track and analyze Carbon Dioxide (CO2) emissions associated with your energy usage.
Running carbon emissions reports
- Click on Reports & Charts from the navigation menu, then select the Carbon Emissions panel.
- Select the Report you want to see.
- Use the fields on the left side of the screen to filter your report information, such as the reporting time period and specific vendors or accounts.
- If applicable, select how you would like the data to be prorated in the Proration By drop-down. *Note: The options that display in this list are configured through the Reports Tab on the General Info page under Organization Setup.
- Line Item Dates: This option provides the closest correlation between the utility service and the month in which it was consumed and is preferred by most Energy Managers. This selection calculates a daily average usage and cost, and then assigns this average to the appropriate number of calendar days, months, or financial periods. For example, if a bill is entered for 11/16/18 - 12/16/18, 14 days of the usage and cost will be applied to November and 16 days of the usage and cost will be applied to December.

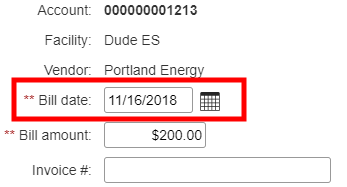
- Bill Date: This option uses the Bill Date from the top left corner of the bill entry page to apply usage and cost to a specific month and is best used for accounting purposes. For example, if the Bill Date is 11/16/18, the usage and cost will be applied to the month of November. *Note: This field may read End Date depending on how your account is configured.
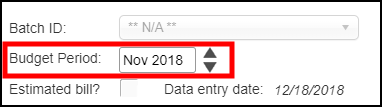
- Budget Period: This option uses the Budget Period listed on the bill entry page to apply usage and cost to the selected month. For example, if the Budget Period is Nov 2018, the usage and cost will be applied to the month of November.
- Click Refresh Report.
- Click Refresh Report.
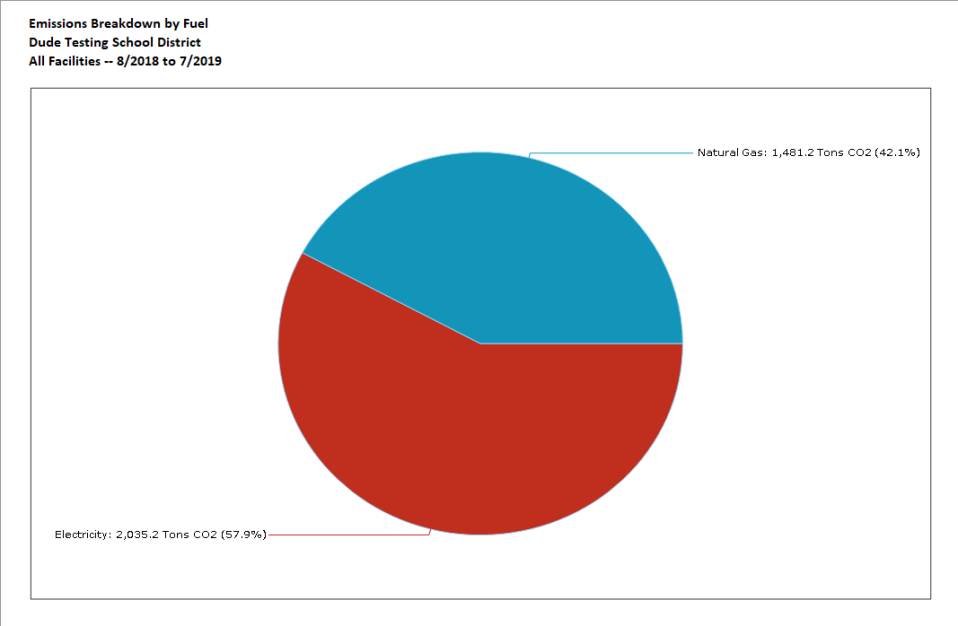
This report breaks down CO2 emissions by percentage for each energy service.
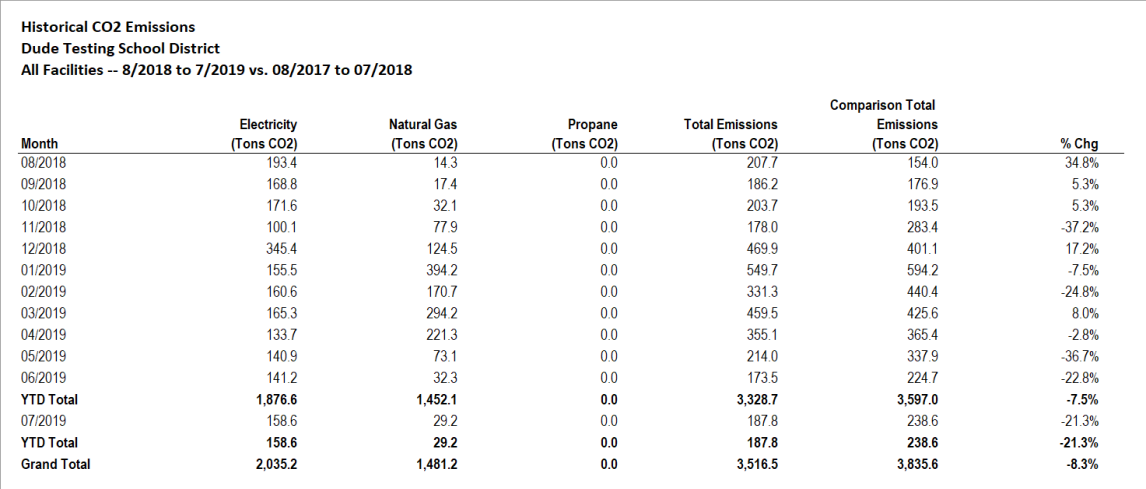
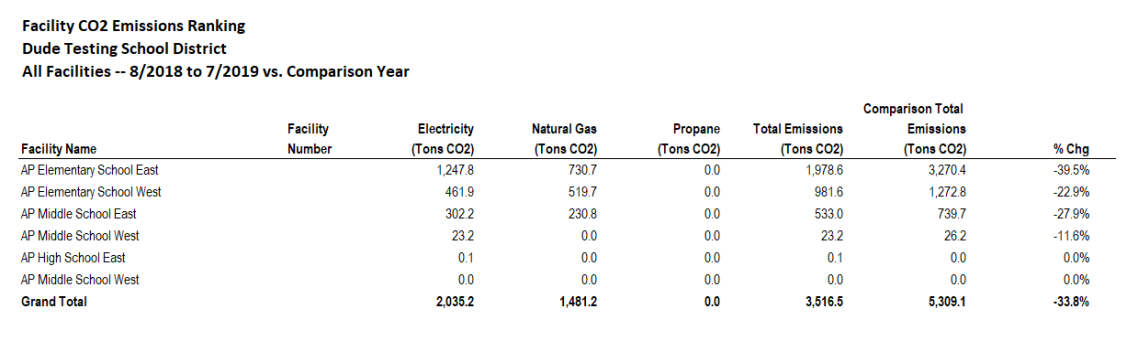
This report ranks facilities based on total CO2 emissions and then provides a change percentage of CO2 emissions compared to the previous year, facility comparison year, or the selected year.
This report provides a monthly breakdown of CO2 emissions and then provides a change percentage of CO2 emissions compared to the previous year or the selected year.