Back to Energy Manager Main Menu
Avoided costs
Cost avoidance allows you to track how much energy you are using in comparison to a normalized base year by taking into account major variables, such as weather and occupancy and adjusting for devaiations in normal energy use. This enables you to compare energy use and cost from the base year to the comparison year using normalized billing data. In addition to the content below, a monthly Virtual Classroom Training on Cost Avoidance is available to walk through the basic setup of Cost Avoidance. *Note: If you do not currently have access to the Cost Avoidance feature, please contact your Sales Representative or Client Services for more information.
How cost avoidance is calculated
Energy Manager uses a Whole Facility Analysis method to measure savings. This method is verified by the International Performance Measurement and Verification Protocols (IPMVP), which has been established as a standard in energy savings. Calculated savings are based on actual energy consumption as measured by utility meters, combined with simple regression modeling to accommodate variables such as weather. This verification method determines savings by studying overall energy use at the facility or sub-facility level. The methodology used in Energy Manager is based on an analysis method known as "multivariate linear regression", which is commonly used in calculations of this type. Cost avoidance is typically performed separately for each utility service at each of your facilities. The analysis considers changes in weather, occupancy, load, operations, and other independent variables as well as allows for adjustments to the base period accordingly.
Our Cost Avoidance Virtual Classroom Training provides a more in depth walk-through of the specific formula and each variable used when calculating avoided costs.
Setting up avoided costs
General Info section setup
- Click Organization Setup in the navigation menu, then click General Info.
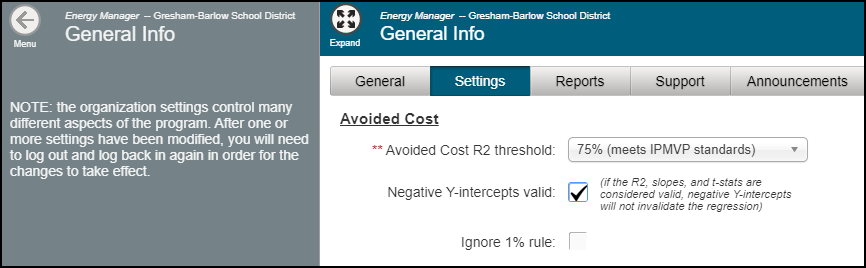
- Select the Settings tab.
- Navigate to the Avoided Cost section.
- Select an Avoided Cost R2 Threshold. *Note: A threshold of 75% meets IPMVP standards.
- If the R2, slopes, and t-stats are valid and there are any negative Y-intercepts, the regression will be considered invalid. If you do not want a negative Y-intercept to invalidate the regression, check the Negative Y-Intercepts Valid box.
- The 1% Rule gives you the option to use the raw base year data instead of the normalized data when a variable unit for a specific month is less than 1% of the units. These units can include data points like a production metric or weather data. If you do not want this to occur, check the Ignore 1% Rule box. *Note: We recommend leaving this box unchecked.
- Click Save at the bottom of the page.
Production metric setup
Avoided costs can also be normalized based on a production metric, or additional independent variables other than weather. This can be anything that will have a monthly value that will correlate with your energy consumption, such as Days in Operation or Humidity.
- Click Organization Setup in the navigation menu, then click Production Metrics.
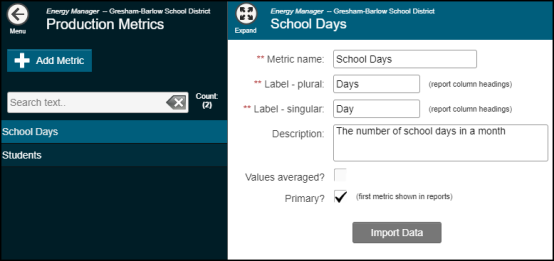
- Click Add Metric.
- Enter a Metric Name.
- Enter the Label - Plural and Label - Singular. This will determine how columns are labeled in reports where production metrics are displayed.
- Enter a Description for the production metric.
- If you want the production metric values to be averaged for a month, check the Values Averaged box.
- If this metric should be the first metric to display in reports, check the Primary? box.
- Click Save.
- If you would like to add another Production Metric, click Yes in the window that displays to return to the New Metric page. Repeat these steps to add any additional production metrics.
- If you do not need to add another production metric, click No in the window that displays to view the new record.
- You have two options to enter Production Metric Values:
- You can import values by clicking the Import Data button to select a file from your computer.
- You can manually enter production metrics.
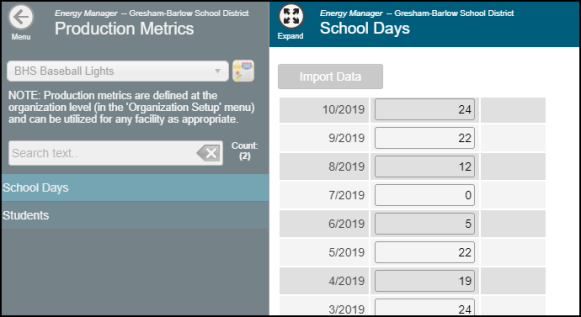
- Click Facility Details in the navigation menu, then click Production Metrics.
- Select a Facility in the top left corner of the page.
- Select the Production Metric on the left side of the page.
- Enter the value for each month in the fields that display.
- Click Save.
Avoided cost global setup
The settings configured on the Avoided Cost Global Setup page will apply to all facilities. You also have the option to set up cost avoidance at individual facilities.
- Click Organization Setup in the navigation menu, then click Avoided Cost Global Setup.
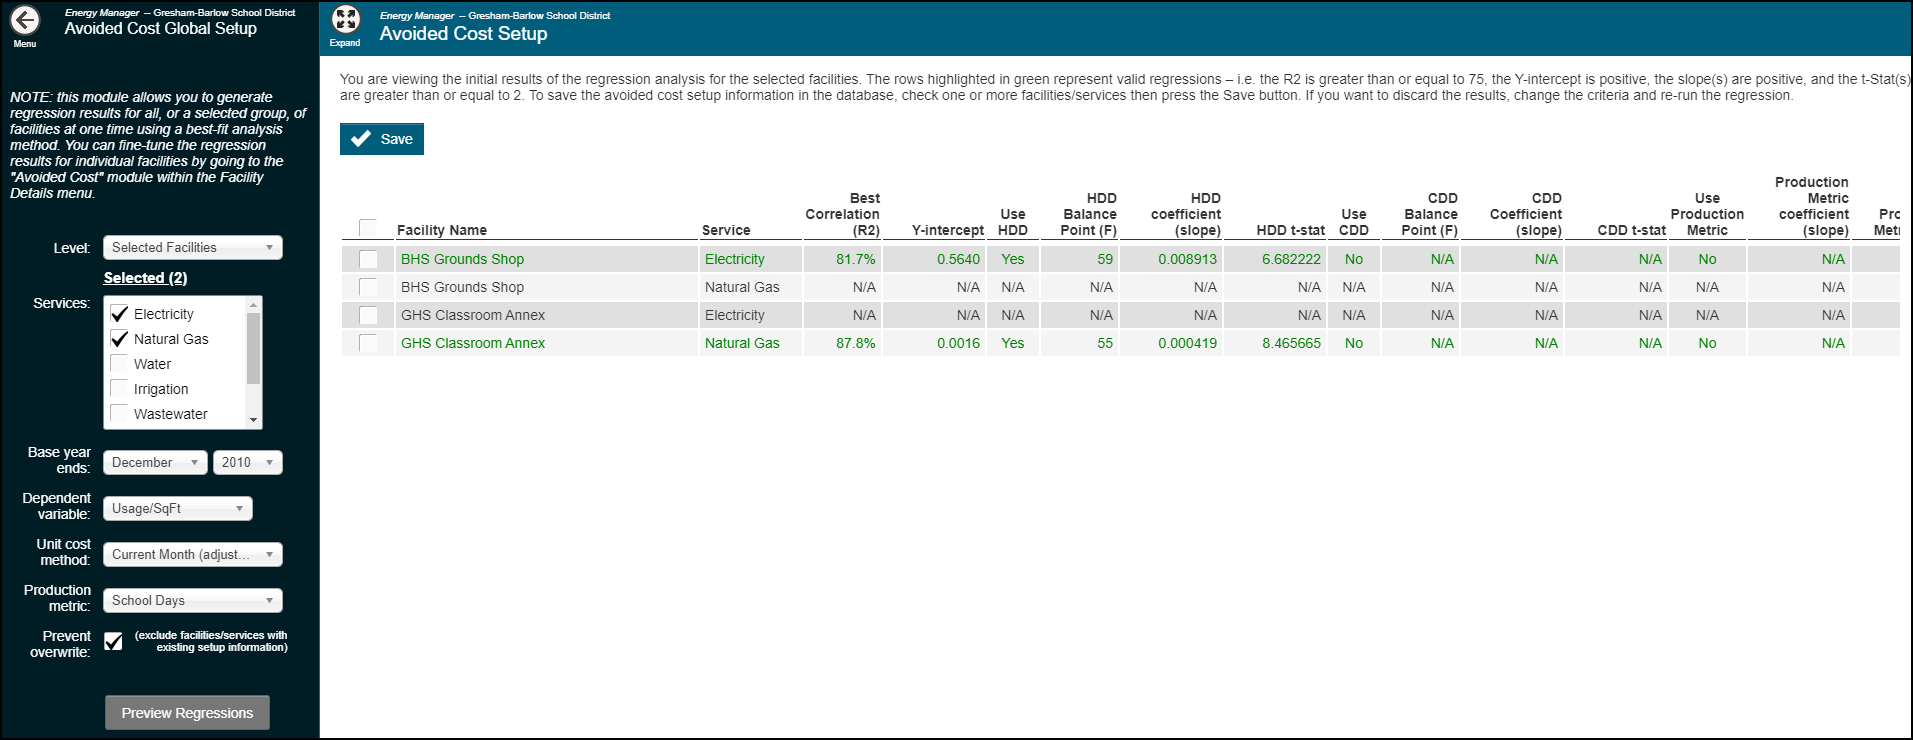
- Select the facilities Level.
- Check the Services you want these setting to apply to.
- Select the Month and Year in which the Base Year Ends.
- Select a Dependent Variable. *Note: We recommend selecting Usage/SqFt as a dependent variable. This will ensure that any additions or renovations are considered when calculating avoided costs.
- Select a Unit Cost Method. This is the unit cost that is applied to the normalized usage. *Note: We recommend selecting Current Month (adjusted). This option will calculate the average annual unit cost and, if a month is 50% above or below the average, it will default to average annual unit cost and alert you about the possible error in data.
- Select a Production Metric.
- If you are setting up avoided costs at the facility level for any of your facilities or sub facilities, check the Prevent Overwrite box. This will exclude any facilities with existing avoided cost setup information from the global settings you are currently configuring.
- To see a preview of the regressions based on this setup, click Preview Regressions. The page to the right will update with the initial results of the regression analysis for the selected facilities.
- A row highlighted in green represents a valid regression where the R2 is greater than or equal to 75%, the Y-Intercept is positive (unless you have selected to validate negative y-intercepts), the slope is positive, and the t-State is greater than or equal to 2.
- To save the avoided cost setup information, check the box beside each Facility Name and click Save.
- To discard the results, select new criteria for the setup options and preview the regressions again.
Avoided cost setup for facilities
- Click Facility Details in the navigation menu, then click Avoided Cost Setup.
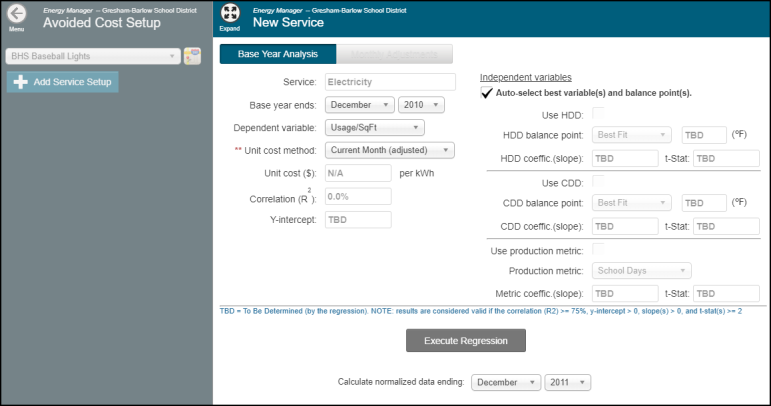
- Select a Facility in the top left corner and click Add Service Setup.
- In the window that displays, select a Service.
- The Base Year Ends, Dependent Variable, and Unit Cost Method fields will default to the values set up in the Avoided Cost Global Setup. Adjust these as needed.
- We recommend keeping the Auto-select Best Variable(s) and Balance Point(s) box checked. This will run multiple iterations of regression statistics to find the best combination of variables with strongest correlations.
- If you would like to set your own independent variables, uncheck the box and enter the appropriate values.
- Click Execute Regression to process the regression model.
- Click the View Results button that displays to view the regression results.
- The options that display along the bottom of the graph allow you to export the data into various file types, such as PDF or Excel. Click an icon to download the data in the corresponding file type.
- Click OK to return to the Avoided Cost Setup page.
- To save the avoided cost setup information, click Save at the bottom of the page.
- To discard the results, click Cancel at the bottom of the page. You will return to the Avoided Cost Setup page where you can repeat these steps to setup the same facility or a different facility.